


 29 January 2016
2016- n° 29In Q4 2015, French GDP increased by 0.2%. Over the year, GDP rose by 1.1% Quarterly national accounts - first estimate - 4th quarter 2015
29 January 2016
2016- n° 29In Q4 2015, French GDP increased by 0.2%. Over the year, GDP rose by 1.1% Quarterly national accounts - first estimate - 4th quarter 2015
From now on, Insee brings forward substantially the publication of the quarterly accounts. The first estimate is henceforth released less than one month after the end of the quarter instead of 45 days up to now. The results will be updated for the second estimate which will be published on 26 February 2016. These shorter deadlines require additional extrapolations for the data unavailable 30 days after the end of the quarter. Slightly wider revisions than previously are likely to arise, particularly in foreign trade and inventories.

From now on, Insee brings forward substantially the publication of the quarterly accounts. The first estimate is henceforth released less than one month after the end of the quarter instead of 45 days up to now. The results will be updated for the second estimate which will be published on 26 February 2016. These shorter deadlines require additional extrapolations for the data unavailable 30 days after the end of the quarter. Slightly wider revisions than previously are likely to arise, particularly in foreign trade and inventories.
In Q4 2015, GDP in volum terms* increased by 0.2%. On average over the year, GDP accelerated: +1.1% in 2015 after +0.2% in 2014.
Total gross fixed capital formation (GFCF) accelerated in Q4 (+0.8% after +0.1%). Conversely, household consumption expenditure slipped back (−0.4% after +0.4% in Q3 2015). Thus, final domestic demand excluding inventory changes rose very slightly and contributed positively to activity (+0.1 points after +0.3 points in the previous quarter). Exports bounced back (+0.6% after −0.6%), while imports kept on increasing (+1.6% after +1.5%). Overall, foreign trade balance contributed negatively to GDP again: −0.3 points after −0.7 points. Conversely, changes in inventories contributed positively (+0.5 points after +0.6 points).
graphiqueGraph1 – GDP and its main components
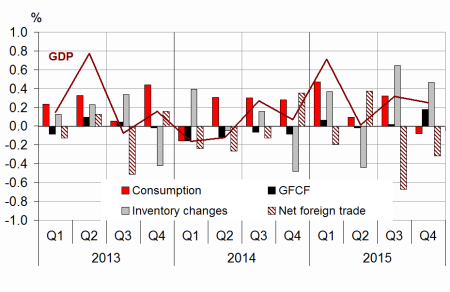
- Source: INSEE
tableauTab1 – Goods and services: supply and uses chain-linked volumes
| 2015 Q1 | 2015 Q2 | 2015 Q3 | 2015 Q4 | 2014 | 2015 | |
|---|---|---|---|---|---|---|
| GDP | 0.7 | 0.0 | 0.3 | 0.2 | 0.2 | 1.1 |
| Imports | 2.2 | 0.7 | 1.5 | 1.6 | 3.9 | 6.1 |
| Household consumption *expenditure | 0.7 | 0.0 | 0.4 | -0.4 | 0.6 | 1.4 |
| General government's *consumption expenditure | 0.3 | 0.3 | 0.4 | 0.4 | 1.5 | 1.5 |
| GFCF | 0.3 | -0.1 | 0.1 | 0.8 | -1.2 | -0.1 |
| *of which NFE | 0.9 | 0.5 | 0.5 | 1.3 | 2.0 | 2.0 |
| Households | -0.8 | -1.1 | -0.5 | 0.1 | -5.3 | -3.0 |
| General government | 0.1 | -0.5 | -0.4 | 0.4 | -6.9 | -3.1 |
| Exports | 1.7 | 2.0 | -0.6 | 0.6 | 2.4 | 5.9 |
| Contributions : | ||||||
| Internal demand excluding inventory changes | 0.5 | 0.1 | 0.3 | 0.1 | 0.5 | 1.1 |
| Inventory changes | 0.4 | -0.4 | 0.6 | 0.5 | 0.2 | 0.2 |
| Net foreign trade | -0.2 | 0.4 | -0.7 | -0.3 | -0.5 | -0.2 |
- *NFE : Non-financial corporated and unincorporated enterprises
- Source: INSEE
Total production gathered pace
Total production in goods and services accelerated in Q4 (+0.5% after +0.3%). Manufactured industry, above all, produced more (+0.9% after +0.2%). Conversely, production on energy fell back. Production in market services increased at the same pace as in Q3 (+0.5%). Activity in construction rebounded (+0.7%) after eight quarters of decline.
On average over the year, total production increased by 1.3% (after +0.7% in 2014): it accelerated in manufactured industry (+1.4% after +0.3%) and in market services (+1.9% after +1.2%), while the decrease was more significant in construction (−2.6% after −2.2%).
tableauTab3 – Production, consumption and GFCF: main components
| 2015 Q1 | 2015 Q2 | 2015 Q3 | 2015 Q4 | 2014 | 2015 | |
|---|---|---|---|---|---|---|
| Production of branches | 0.9 | -0.1 | 0.3 | 0.5 | 0.7 | 1.3 |
| Goods | 1.6 | -0.7 | 0.2 | 0.5 | 0.1 | 1.2 |
| Manufactured Industry | 1.5 | -0.5 | 0.2 | 0.9 | 0.3 | 1.4 |
| Construction | -0.6 | -0.9 | -0.8 | 0.7 | -2.2 | -2.6 |
| Market services | 0.8 | 0.2 | 0.5 | 0.5 | 1.2 | 1.9 |
| Non-market services | 0.3 | 0.3 | 0.4 | 0.3 | 1.3 | 1.2 |
| Household consumption | 0.7 | 0.0 | 0.4 | -0.4 | 0.6 | 1.4 |
| Food products | 0.2 | 0.8 | -0.2 | 0.3 | 0.2 | 1.1 |
| Energy | 3.5 | -2.2 | 1.8 | -3.5 | -5.7 | 1.4 |
| Engineered goods | 1.6 | -0.1 | 0.9 | -0.8 | 1.9 | 2.5 |
| Services | 0.3 | 0.2 | 0.2 | 0.1 | 0.7 | 0.9 |
| GFCF | 0.3 | -0.1 | 0.1 | 0.8 | -1.2 | -0.1 |
| Manufactured goods | 1.3 | 0.1 | 1.3 | 1.7 | 1.3 | 2.0 |
| Construction | -0.7 | -0.9 | -0.8 | 0.5 | -3.4 | -3.0 |
| Market services | 1.1 | 1.0 | 0.5 | 0.8 | 0.4 | 2.6 |
- Source: INSEE
Household consumption fell
Household consumption expenditure fell back by 0.4% in Q4 2015 (after +0.4% in Q3). Expenditure in goods declined (−0.9% after +0.7%), in particular in energy and in clothing. Expenditure on energy (in gas, electricity and in refined petroleum products) dropped off sharply (−3.5% after +1.8%), notably because of temperatures above their seasonal average. In services, consumption decelerated slightly (+0.1% after +0.2%).
* This growth rate is seasonally and working-day adjusted; volumes are chain-linked previous-year-prices volumes.
On average over the year, household consumption accelerated (+1.4% in 2015 after +0.6%), notably because of expenditure on energy.
Investment increased sharply
Total GFCF accelerated in Q4 2015 (+0.8% after +0.1%). Investment in construction increased (+0.5%) for the first time since Q3 2013. Investment in manufactured goods accelerated (+1.7% after +1.3%) mainly that in transport equipment (+4.9% after +1.9%). To a lesser extent, investment in market services picked up too (+0.8% after +0.5%).
However, over the year 2015, total GFCF was virtually stable: −0.1% after −1.2%.
External balance declined again but less than in Q3
In Q4 2015, imports accelerated slightly (+1.6% after +1.5%). Imports in transport equipment increased again at a brisk pace (+4.5% after +3.0%); however, those in refined petroleum products slowed down sharply (−1.2% after +10.1%). Exports rebounded (+0.6% after −0.6%), notably because of transport equipment. All in all, foreign trade dampened activity again, for 0.3 points this quarter.
On average over the year, importations accelerated (+6.1% after +3.9%), but less than exports (+5.9% after +2.4%). External balance contributed negatively again to GDP in 2015 (−0.2 points) but less than in 2014 (−0.5 points).
At the end of 2015, changes in inventories contributed positively to GDP again
Changes in inventories contributed for +0.5 points to GDP growth in Q4 2015, after +0.6 points. Stockpiling concerned notably refined petroleum products and equipment goods.
Over the year, changes in inventories contributed up to +0.2 points to activity, as in 2014.
Revisions
GDP growth in Q3 2015 is confirmed (+0.3%). Mild revisions to various aggregates offset; they are mainly due to revisions of indicators and to updates of seasonal adjustment coefficients.
tableauTab2 – Sectoral accounts
| 2015 Q1 | 2015 Q2 | 2015 Q3 | 2015 Q4 | 2014 | 2015 (ovhg) | |
|---|---|---|---|---|---|---|
| Profit ratio of NFC* (level) | 31.0 | 30.9 | 31.3 | 29.5 | ||
| Household purchasing power | 1.2 | -0.2 | 1.0 | 1.1 | 1.8 |
- *NFC: non-financial corporations
- Source: INSEE
tableauTab4 – Households' disposable income and ratios of households' account
| 2015 Q1 | 2015 Q2 | 2015 Q3 | 2015 Q4 | 2014 | 2015 (ovhg) | |
|---|---|---|---|---|---|---|
| HDI | 1.1 | 0.2 | 0.8 | 1.1 | 1.7 | |
| Household purchasing power | 1.2 | -0.2 | 1.0 | 1.1 | 1.8 | |
| HDI by cu* (purchasing power) | 1.1 | -0.4 | 0.9 | 0.7 | 1.3 | |
| Adjusted HDI (purchasing power) | 1.0 | -0.1 | 0.8 | 1.3 | 1.7 | |
| Saving rate (level) | 15.3 | 15.1 | 15.5 | 15.1 | ||
| Financial saving rate (level) | 6.3 | 6.2 | 6.7 | 6.0 |
- *cu: consumption unit
- Source: INSEE
tableauTab5 – Ratios of non-financial corporations' account
| 2015 Q1 | 2015 Q2 | 2015 Q3 | 2015 Q4 | 2014 | |
|---|---|---|---|---|---|
| Profit share | 31.0 | 30.9 | 31.3 | 29.5 | |
| Investment ratio | 22.9 | 23.0 | 22.9 | 23.1 | |
| Savings ratio | 19.2 | 19.6 | 20.4 | 17.4 | |
| Self-financing ratio | 84.1 | 85.1 | 89.0 | 75.2 |
- Source: INSEE
tableauTab6 – Expenditure, receipts and net borrowing of public administrations
| 2015 Q1 | 2015 Q2 | 2015 Q3 | 2015 Q4 | 2014 | |
|---|---|---|---|---|---|
| In billions of euros | |||||
| Total expenditure | 308.7 | 310.9 | 310.9 | 1226.9 | |
| Total receipts | 289.8 | 289.8 | 288.7 | 1142.7 | |
| Net lending (+) or borrowing (-) | -18.9 | -21.1 | -22.2 | -84.2 | |
| In % of GDP | |||||
| Net lending (+) or borrowing (-) | -3.5 | -3.9 | -4.1 | -3.9 |
- Source: INSEE
Pour en savoir plus
