


 26 May 2016
2016- n° 137In Q1 2016, prices of second hand housing rose, and the volume of transactions expanded Indexes of prices of second-hand dwellings - 1st Quarter 2016
26 May 2016
2016- n° 137In Q1 2016, prices of second hand housing rose, and the volume of transactions expanded Indexes of prices of second-hand dwellings - 1st Quarter 2016
In Q1 2016, prices of second-hand dwellings increased for the third quarter in a row: +0.7% quarter-on-quarter (according to provisional results, s.a. data), after +0.2% in the previous quarter.
In Q1 2016, prices of second-hand dwellings increased for the third quarter in a row: +0.7% quarter-on-quarter (according to provisional results, s.a. data), after +0.2% in the previous quarter.
For the first time since the beginning of 2012, prices of second-hand dwellings also increased over the year: +0.5% compared to Q1 2015. This was only due to prices of houses, which went up by 1.1% between Q1 2015 and Q1 2016. Prices of flats were still decreasing, but this fall continued to ease this quarter (−0.2% after −1.1% and −2.0%).
In Île-de-France, prices of second-hand dwellings recovered slightly
In Île-de-France, prices of second-hand dwellings rose slightly in Q1 2016 (+0.3%, after a stability).
Year-on-year, prices edged up after a continuous downwards trend since mid-2012: +0.2% between Q1 2015 and Q1 2016, after −0.9% y-o-y in Q4 and −1.6% in Q3. This slight rebound was due to houses, whose prices rallied (+0.6% year-on-year, after −0.2%) whereas prices of flats were stable.
In provincial France, prices increased for the third quarter in a row
In provincial France, prices of second-hand dwellings, on the rise for the third consecutive quarter, accelerated: +0.9% q-o-q, after +0.3% in Q4 2015 and +0.1% in Q3. Year-on-year, prices also rose: +0.7% compared to Q1 2015. Prices of houses remained higher than one year before (+1.2% between Q1 2015 and Q1 2016) while prices of flats declined again (−0.4%).
graphiqueGraphique1a – Prices of second-hand dwellings in metropolitan France
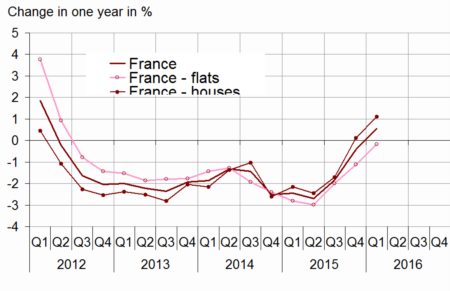
- Sources: INSEE, French notaries - Database Bien, Perval society
graphiqueGraphique2a – Prices of second-hand dwellings in Île-de-France
- Scope: Île-de-France
- Sources: INSEE, French notaries - Database Bien, Perval society
tableauTableau1a – Variation in prices of second-hand dwellings in metropolitan France
| change in | ||||||
|---|---|---|---|---|---|---|
| 3 months (S.A.) | 12 months | |||||
| 2015 Q3 | 2015 Q4 (sd) | 2016 Q1 (p) | 2015 Q3 | 2015 Q4 (sd) | 2016 Q1 (p) | |
| France | 0.2 | 0.2 | 0.7 | -1.8 | -0.4 | 0.5 |
| Flats | 0.1 | 0.1 | 0.3 | -2.0 | -1.1 | -0.2 |
| Houses | 0.2 | 0.3 | 1.0 | -1.7 | 0.1 | 1.1 |
- (p): provisional; (sd): semi-definitive
- Scope: Metropolitan France
- Sources: INSEE, French notaries - Database Bien, Perval society
Sharper increase in the annual volume of transactions
The recovery in annual transaction volume, started in early 2015, continued in Q1 2016: in March, the number of transactions carried out over the last twelve months was estimated at 818,000, against 802,000 in December 2015. This volume of transactions was considerably higher than the one recorded one year before (698,000 in March 2015, that is +17.2%).
graphiqueGraphique3a – Volume of transactions of second-hand dwellings over the last 12 months
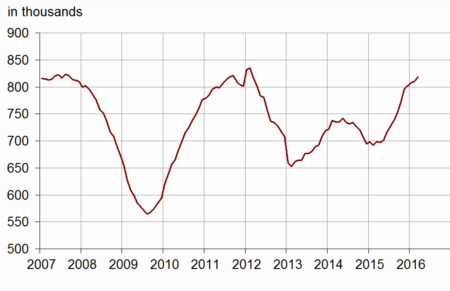
- Scope: Metropolitan France
- Sources: CGEDD, based on notarial databases and DGFiP (MEDOC)
Revisions
The second-hand housing price index is revised to include transactions recorded after the previous publication. In comparison with the results released on 4 April 2016, the change in prices in Q4 2015 has been revised downwards by −0.2 points overall, namely −0.2 for houses and −0.1 for flats. The overall change in prices in Q4 2015 stands at +0.2%, instead of +0.4% (figure estimated on 4 April) and +0.5% estimated on 25 February.
tableauTableau2a – Variation in prices of second-hand dwellings in metropolitan France
| Change in | ||||||
|---|---|---|---|---|---|---|
| 3 months (S.A.) | 12 months | |||||
| 2015 Q3 | 2015 Q4 (sd) | 2016 Q1 (p) | 2015 Q3 | 2015 Q4 (sd) | 2016 Q1 (p) | |
| Metropolitan France | 0.2 | 0.2 | 0.7 | -1.8 | -0.4 | 0.5 |
| - Flats | 0.1 | 0.1 | 0.3 | -2.0 | -1.1 | -0.2 |
| - Houses | 0.2 | 0.3 | 1.0 | -1.7 | 0.1 | 1.1 |
| Île-de-France | 0.4 | 0.0 | 0.3 | -1.6 | -0.9 | 0.2 |
| Provincial France | 0.1 | 0.3 | 0.9 | -2.0 | -0.2 | 0.7 |
| Flats | ||||||
| Île-de-France | 0.4 | 0.2 | -0.1 | -1.6 | -1.1 | 0.0 |
| - Paris | 0.7 | 1.0 | -0.1 | -1.0 | 0.4 | 1.2 |
| - Seine-et-Marne | -0.6 | -0.2 | -1.1 | -2.9 | -1.8 | -1.8 |
| - Yvelines | 0.5 | -1.1 | 0.4 | -2.6 | -4.0 | -1.0 |
| - Essonne | -0.2 | 0.0 | -0.5 | -2.9 | -1.4 | -1.1 |
| - Hauts-de-Seine | 0.4 | -0.7 | 0.2 | -1.4 | -2.6 | -0.7 |
| - Seine-Saint-Denis | -0.2 | -0.2 | -0.3 | -1.6 | -2.0 | -1.1 |
| - Val-de-Marne | -0.1 | -0.1 | 0.0 | -1.9 | -1.7 | -0.8 |
| - Val-d'Oise | -0.7 | -0.2 | 0.2 | -3.3 | -2.0 | -1.2 |
| Provincial France | -0.2 | 0.0 | 0.6 | -2.4 | -1.1 | -0.4 |
| - Conurbation > 10 000 inhabitants | -0.2 | 0.0 | ** | -2.5 | -1.1 | ** |
| - Central town | -0.2 | -0.1 | ** | -2.6 | -1.1 | ** |
| - Suburb | -0.3 | 0.2 | ** | -2.2 | -1.1 | ** |
| - Conurbation < 10 000 inhabitants | 0.3 | -0.7 | ** | -1.7 | -0.9 | ** |
| Houses | ||||||
| Île-de-France | 0.5 | -0.5 | 0.9 | -1.5 | -0.5 | 0.6 |
| - Seine-et-Marne | -0.1 | -0.2 | 0.7 | -1.8 | -0.1 | 0.2 |
| - Yvelines | 0.4 | -1.1 | 1.3 | -1.1 | -0.8 | 0.7 |
| - Essonne | 0.5 | -0.6 | 0.6 | -1.3 | -0.2 | -0.1 |
| - Hauts-de-Seine | 1.3 | -2.4 | 3.0 | -1.6 | -2.7 | 2.7 |
| - Seine-Saint-Denis | 1.5 | 0.8 | -0.4 | -1.6 | 1.1 | -0.4 |
| - Val-de-Marne | 0.8 | -0.3 | 0.8 | -1.5 | -0.6 | 0.7 |
| - Val-d'Oise | 0.1 | 0.4 | 0.0 | -1.7 | 0.2 | 0.4 |
| Provincial France | 0.2 | 0.4 | 1.0 | -1.7 | 0.3 | 1.2 |
| Nord-Pas de Calais | 1.2 | -0.4 | ** | -1.0 | 0.7 | ** |
| - Flats | -1.3 | -1.0 | ** | -3.1 | -2.0 | ** |
| - Houses | 1.8 | -0.2 | ** | -0.5 | 1.3 | ** |
| - Lille Houses | 4.4 | -1.1 | ** | 1.2 | 2.2 | ** |
| Provence-Alpes-Côte d'Azur | -0.7 | 0.4 | ** | -2.9 | -0.9 | ** |
| - Flats | -0.7 | -0.5 | ** | -2.3 | -1.7 | ** |
| - Houses | -0.7 | 1.4 | ** | -3.5 | -0.1 | ** |
| - Marseille Flats | -1.7 | 0.2 | ** | -2.5 | -2.7 | ** |
| Rhône-Alpes | 0.5 | 1.1 | ** | -1.5 | 0.4 | ** |
| - Flats | 0.1 | 0.9 | ** | -1.8 | 0.0 | ** |
| - Houses | 0.9 | 1.3 | ** | -1.3 | 0.8 | ** |
| - Lyon Flats | 2.1 | -0.2 | ** | 0.1 | 1.0 | ** |
- ** index released on 4 July 2016
- (p): provisional
- (sd): semi-definitive
- Sources: INSEE, French notaries - Database Bien, Perval society
Pour en savoir plus
