


 28 January 2016
2016- n° 25In December 2015, agricultural producer prices decreased again (−1.4%) Indices of agricultural prices - December 2015
28 January 2016
2016- n° 25In December 2015, agricultural producer prices decreased again (−1.4%) Indices of agricultural prices - December 2015
In December 2015, overall agricultural prices edged down again compared with the previous month (−1.4%). Over one year, they dropped as well (−1.5%).
In December 2015, overall agricultural prices edged down again compared with the previous month (−1.4%). Over one year, they dropped as well (−1.5%).
Downturn in december in cereal, oleaginous and wine prices
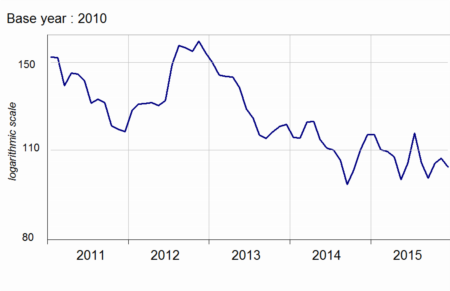
Cereal prices dropped in December (−3.1%). This fall likely reflected an alignment of prices down to international competition, partly due to the appreciation of the euro, in the context of a plentiful supply of soft wheat.
graphiquecereal – Producer prices of cereals
Wine prices dipped slightly in December (−0.4%; +0.7% over one year). The French global production was slightly larger in 2015 than the previous one.
Jump in potatoes prices year-over-year
Compared to December 2014, potatoe prices increased by nearly 90 %. The 2015 crop reached its long-term average whereas the previous one was exceptional.
Over one year, vegetables prices fell and fresh fruit prices rose a little
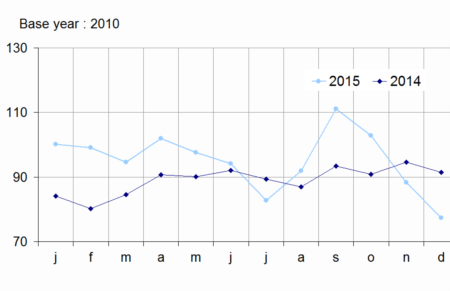
Fresh vegetables prices diminished sharply yoy (−15.5%). The mild weather stimulated the growth of open air vegetables (lettuces, cauliflowers), thus hastening their harvests.
graphiquevegetable – Producer prices of fresh vegetables
On the contrary, fresh fruits prices increased a little yoy (+2.1%). Apple stocks were high but this fruit was easily sold through exportations. The production of Corsican clementines was less abundant than the previous years.
Overall near stability in animal prices
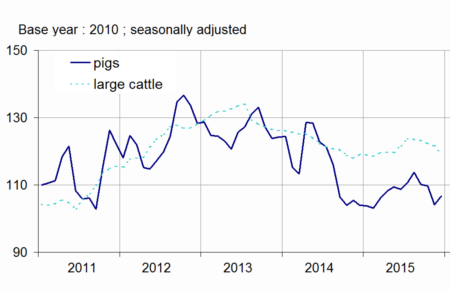
On a seasonally adjusted basis, prices of animals were virtually stable in December (−0.1%). Pig price rebounded a little (+2.4%) but remained at a low level due to excess supply and European competition. Large cattle prices slid (−3.1% over the last three months) due to a sluggish consumption.
graphiquepig – Producer prices of pigs and large cattle
Egg prices weakened as well (−5.3 % over the last three months): the consumtion was stable while the production had been increasing regularly since the implementation of new standards for henhouses two years ago. The drop in cow milk prices in 2015 (−8.3% yoy) reflected the excess supply: the exportations opportunities were reduced by the Russian embargo and lower Chinese demand.
tableauTab1 – Indices of producer prices of agricultural products (IPPAP)
| Weights | Dec. 2015 | Variation as % over | |||
|---|---|---|---|---|---|
| a month | 3 months | a year | |||
| raw | Seasonally adjusted | raw | |||
| Agricultural goods output | 1000 | 111.2 | –1.4 | –0.9 | –1.5 |
| excluding fruits and vegetables | 900 | 113.2 | –0.8 | +0.8 | –1.0 |
| Crop output (excluding fruits and vegetables) | 505 | 117.4 | –1.4 | +1.0 | +0.7 |
| Cereals | 188 | 103.5 | –3.1 | +3.9 | –11.0 |
| of which soft wheat | 112 | 100.2 | –4.0 | +8.1 | –11.9 |
| grain maize | 41 | 96.7 | –2.2 | +2.2 | +1.4 |
| Potatoes | 26 | 174.0 | /// | /// | +86.7 |
| Wines | 177 | 130.5 | –0.4 | +1.2 | +0.7 |
| Protected designation of origin | 84 | 136.8 | –0.2 | +2.8 | +1.5 |
| other wines | 23 | 145.3 | –1.7 | –1.9 | –1.1 |
| Oleaginous | 49 | 103.2 | –1.4 | +3.7 | +10.5 |
| Horticultural products | 30 | 114.3 | –0.7 | +1.1 | +2.2 |
| Other crop products | 36 | 107.7 | +0.3 | +0.4 | –0.6 |
| Fruits and vegetables (1) | 100 | 92.6 | /// | /// | –7.0 |
| Fresh vegetables | 53 | 77.3 | /// | /// | –15.5 |
| Fresh fruits | 35 | 109.3 | /// | /// | +2.1 |
| Animal output | 395 | 108.0 | –0.1 | +0.5 | –3.2 |
| Animals | 234 | 111.2 | –0.1 | –1.3 | +0.7 |
| of which large cattle | 96 | 116.3 | –1.8 | –3.1 | +0.3 |
| calves | 26 | 110.6 | +1.7 | +9.7 | –1.6 |
| pigs | 54 | 101.3 | +2.4 | –3.1 | +2.7 |
| sheep | 10 | 118.3 | +1.2 | –2.3 | –4.5 |
| poultry | 46 | 111.1 | –0.5 | –0.1 | +2.1 |
| of which chicken | 28 | 111.2 | –0.6 | –0.4 | +2.5 |
| Milk | 147 | 101.1 | 0.0 | +4.5 | –8.3 |
| of which cow milk (2) | 137 | 99.9 | 0.0 | +4.8 | –9.0 |
| Eggs | 15 | 125.9 | +0.2 | –5.3 | –12.2 |
- (1) Including vegetables for industry.
- (2)The price for Dec. is not yet known and therefore is estimated by carrying forward the seasonally adjusted price of November
- Sources: INSEE, SSP (ministry in charge of agriculture)
Purchase prices of means of production slipped in December
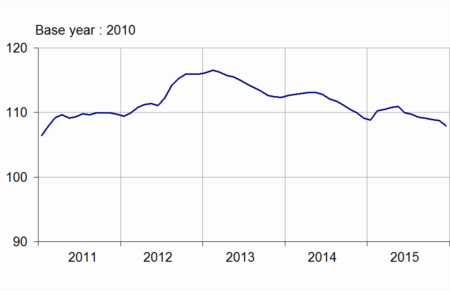
In December 2015, intermediate consumption prices fell compared to the previous month (−1.0%) due to slumping energy prices (−7.9%). Over one year they diminished too, by 1.7%, mainly because of less expensive energy (−13.7%). Capital goods prices were virtually stable (+0.2%). Over one year, they increased by 0.9%, driven up by the rise in material prices (+1.3%).
graphiquemeans – Purchase prices of the means of agricultural production
- Indices of purchase prices of the means of agricultural production (IPAMPA)
| Weights | Dec. 2015 | Variation as % over | |||
|---|---|---|---|---|---|
| a month | 3 months | a year | |||
| Total input | 1000 | 107.9 | –0.7 | –1.0 | –1.1 |
| Intermediate consumptions | 764 | 108.4 | –1.0 | –1.5 | –1.7 |
| Energy | 100 | 86.9 | –7.9 | –8.8 | –13.7 |
| Seeds | 57 | 109.3 | –0.3 | +0.1 | +1.1 |
| Fertilisers and soil improvers | 92 | 115.7 | –0.2 | –0.8 | –1.3 |
| Plant protection products | 78 | 100.3 | –0.2 | 0.0 | 0.0 |
| Animal feed | 205 | 115.8 | –0.3 | –1.5 | –0.6 |
| Veterinary expenses | 43 | 115.0 | 0.0 | –0.1 | +2.4 |
| Small equipment and tools | 17 | 110.2 | +0.3 | +0.3 | +0.2 |
| Maintenance of materials | 67 | 113.6 | +0.2 | +0.2 | +1.7 |
| Maintenance of buildings | 9 | 106.6 | 0.0 | –0.1 | –0.3 |
| Other goods and services | 97 | 101.3 | 0.0 | +0.1 | –0.5 |
| Goods and services contributing to investment | 236 | 106.9 | +0.2 | +0.4 | +0.9 |
| Material | 186 | 107.8 | +0.3 | +0.5 | +1.3 |
| Tractors | 79 | 107.5 | +0.2 | +0.4 | +1.8 |
| Machinery and plant for cultivation | 36 | 110.3 | +1.0 | +0.8 | +1.4 |
| Machinery and plant for harvesting | 42 | 108.6 | +0.6 | +1.0 | +1.7 |
| Utility vehicles | 18 | 104.5 | –0.6 | –0.1 | –0.5 |
| Buildings | 50 | 103.4 | 0.0 | –0.1 | –0.7 |
- (1) The repayment of the domestic tax on energy products (TICPE) benefiting farmers has been applied in advance for the year 2015
- Sources: INSEE - SSP (ministry in charge of agriculture)
Documentation
Methodology (pdf,122 Ko)
Pour en savoir plus
Time series : Indices of agricultural prices
