


 25 February 2016
2016- n° 49In Q4 2015, second hand housing prices were stable over the year, and transaction
volume kept rising Indexes of prices of second-hand dwellings - 4th Quarter 2015
25 February 2016
2016- n° 49In Q4 2015, second hand housing prices were stable over the year, and transaction
volume kept rising Indexes of prices of second-hand dwellings - 4th Quarter 2015
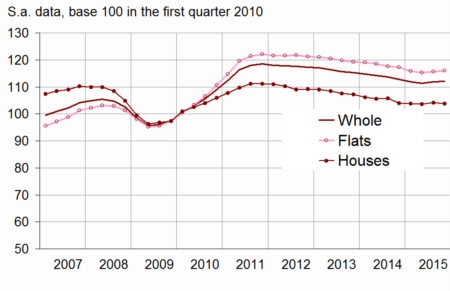
In Q4 2015, prices of second-hand dwellings were slightly increasing for the second quarter in a row: +0.5% quarter-on-quarter (according to provisional results, s.a. data), after +0.2% in the previous quarter.
In Q4 2015, prices of second-hand dwellings were slightly increasing for the second quarter in a row: +0.5% quarter-on-quarter (according to provisional results, s.a. data), after +0.2% in the previous quarter.
Year-on-year, prices of second-hand dwellings were stable. For the first time since early 2012, prices of houses increased over a year: they rose by 0.6% between Q4 2014 and Q4 2015. By contrast, prices of flats were still decreasing, but this fall eased (−0.8% after −2.0%).
In Île-de-France, prices of second-hand dwellings were virtually stable over the quarter
In Île-de-France, prices of second-hand dwellings were virtually stable in Q4 2015 (+0.1%, after +0.4%).
Year-on-year, prices continued to decrease, but more slowly: −0.8% compared with Q4 2014, after −1.6% in the third quarter and −2.5% in the second one. Prices of flats fell by –1.0%, whereas prices of houses were almost stable (−0.2%).
In provincial France, prices increased slightly
In provincial France, prices of second-hand dwellings rose in Q4 2015: +0.7% q-o-q, after +0.1%. Year-on-year, prices edged up: +0.3% compared to Q4 2014. There too, prices of houses recovered (+0.7%) while prices of flats were still decreasing (−0.6%).
graphiqueGraphique1a – Prices of second-hand dwellings

- Sources: INSEE, French notaries - Database Bien, Perval society
graphiqueGraphique2a – Prices of second-hand dwellings in Île-de-France
- Sources: INSEE, French notaries - Database Bien, Perval society
tableauTableau1a – Variation in prices of second-hand dwellings in metropolitan France
| change in | ||||||
|---|---|---|---|---|---|---|
| 3 months (S.A.) | 12 months | |||||
| 2015 Q2 | 2015 Q3 (sd) | 2015 Q4 (p) | 2015 Q2 | 2015 Q3 (sd) | 2015 Q4 (p) | |
| France | -0.5 | 0.2 | 0.5 | -2.7 | -1.8 | 0.0 |
| Flats | -0.6 | 0.1 | 0.4 | -3.0 | -2.0 | -0.8 |
| Houses | -0.4 | 0.3 | 0.7 | -2.4 | -1.7 | 0.6 |
- (p): provisional
- (sd): semi-definitive
- Sources: INSEE, French notaries - Database Bien, Perval society
The annual volume of transactions kept
The recovery in annual transaction volume, started early 2015, continued in Q4: in December, the number of transactions carried out over the last twelve months was estimated at 803,000, against 751,000 in September. This volume of transaction was considerably higher than the one recorded one year before (694,000 in December 2014, that is +15.7%).
graphiqueGraphique3a – Volume of transactions of second-hand dwellings over the last 12 months
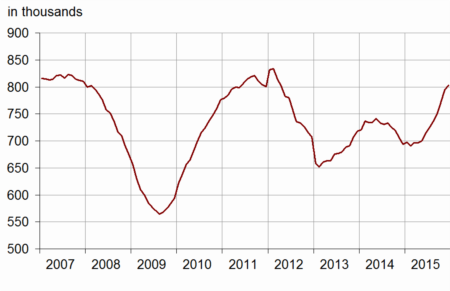
- Sources: CGEDD, based on notarial databases and DGFiP (MEDOC)
Revisions
The second-hand housing price index is revised to include transactions recorded after the previous publication. In comparison with the results released on 5 January, the change in prices in the third quarter of 2015 has been revised downwards: −0.1 points for the whole, −0.1 for houses, −0.2 for flats. The overall change in prices in Q3 2015 stands at +0.2%, instead of +0.3% (figure estimated on 5 January) and +0.5% estimated on 26 November.
tableauTableau2a – Variation in prices of second-hand dwellings in metropolitan France
| Change in | ||||||
|---|---|---|---|---|---|---|
| 3 months (S.A.) | 12 months | |||||
| 2015 Q2 | 2015 Q3 (sd) | 2015 Q4 (p) | 2015 Q2 | 2015 Q3 (sd) | 2015 Q4 (p) | |
| Metropolitan France | -0.5 | 0.2 | 0.5 | -2.7 | -1.8 | 0.0 |
| - Flats | -0.6 | 0.1 | 0.4 | -3.0 | -2.0 | -0.8 |
| - Houses | -0.4 | 0.3 | 0.7 | -2.4 | -1.7 | 0.6 |
| Île-de-France | -0.4 | 0.4 | 0.1 | -2.5 | -1.6 | -0.8 |
| Provincial France | -0.5 | 0.1 | 0.7 | -2.8 | -1.9 | 0.3 |
| Flats | ||||||
| Île-de-France | -0.5 | 0.4 | 0.3 | -2.8 | -1.6 | -1.0 |
| - Paris | -0.4 | 0.7 | 0.9 | -2.9 | -1.0 | 0.4 |
| - Seine-et-Marne | 0.1 | -0.6 | 0.1 | -2.2 | -2.9 | -1.4 |
| - Yvelines | -0.9 | 0.5 | -0.9 | -3.8 | -2.6 | -3.8 |
| - Essonne | -0.4 | -0.2 | 0.3 | -3.6 | -2.9 | -1.1 |
| - Hauts-de-Seine | -0.7 | 0.4 | -0.5 | -2.3 | -1.4 | -2.5 |
| - Seine-Saint-Denis | -0.3 | -0.2 | 0.2 | -1.8 | -1.6 | -1.6 |
| - Val-de-Marne | -0.5 | -0.1 | 0.2 | -2.4 | -1.9 | -1.3 |
| - Val-d'Oise | -0.5 | -0.7 | 0.4 | -3.4 | -3.3 | -1.4 |
| Provincial France | -0.8 | -0.2 | 0.4 | -3.2 | -2.4 | -0.6 |
| - Conurbation > 10 000 inhabitants | -0.8 | -0.2 | ** | -3.2 | -2.5 | ** |
| - Central town | -0.9 | -0.2 | ** | -3.3 | -2.6 | ** |
| - Suburb | -0.5 | -0.3 | ** | -3.0 | -2.2 | ** |
| - Conurbation < 10 000 inhabitants | -0.5 | 0.2 | ** | -2.9 | -1.8 | ** |
| Houses | ||||||
| Île-de-France | -0.3 | 0.5 | -0.3 | -1.9 | -1.5 | -0.2 |
| - Seine-et-Marne | -0.2 | -0.1 | 0.4 | -1.7 | -1.8 | 0.5 |
| - Yvelines | 0.1 | 0.4 | -0.8 | -1.4 | -1.1 | -0.5 |
| - Essonne | -0.6 | 0.5 | 0.0 | -1.9 | -1.3 | 0.4 |
| - Hauts-de-Seine | 0.8 | 1.3 | -3.0 | -1.5 | -1.6 | -3.4 |
| - Seine-Saint-Denis | -2.3 | 1.5 | 1.0 | -3.6 | -1.6 | 1.3 |
| - Val-de-Marne | -0.6 | 0.8 | -0.2 | -2.3 | -1.5 | -0.5 |
| - Val-d'Oise | -0.2 | 0.1 | 0.8 | -1.8 | -1.7 | 0.6 |
| Provincial France | -0.4 | 0.2 | 0.9 | -2.6 | -1.7 | 0.7 |
| Nord-Pas de Calais | -1.4 | 1.2 | ** | -3.2 | -1.0 | ** |
| - Flats | 0.0 | -1.3 | ** | -4.9 | -3.1 | ** |
| - Houses | -1.7 | 1.8 | ** | -2.8 | -0.5 | ** |
| - Lille Houses | -2.9 | 4.4 | ** | -3.6 | 1.1 | ** |
| Provence-Alpes-Côte d'Azur | 0.8 | -0.7 | ** | -3.1 | -2.9 | ** |
| - Flats | 0.4 | -0.7 | ** | -2.5 | -2.3 | ** |
| - Houses | 1.2 | -0.7 | ** | -3.8 | -3.5 | ** |
| - Marseille Flats | 2.1 | -1.4 | ** | -3.1 | -2.2 | ** |
| Rhône-Alpes | -1.0 | 0.5 | ** | -2.8 | -1.5 | ** |
| - Flats | -1.6 | 0.1 | ** | -2.7 | -1.7 | ** |
| - Houses | -0.4 | 0.9 | ** | -3.0 | -1.2 | ** |
| - Lyon Flats | -2.5 | 2.1 | ** | -2.4 | 0.1 | ** |
- ** index released on 4 April 2016
- (p): provisional
- (sd): semi-definitive
- Sources: INSEE, French notaries - Database Bien, Perval society
Pour en savoir plus
