


 25 March 2016
2016- n° 82At the end of Q4 2015, the Maastricht debt accounted for 95.7 % of GDP Debt of the general government according to the Maastricht definition - 4th quarter
2015
25 March 2016
2016- n° 82At the end of Q4 2015, the Maastricht debt accounted for 95.7 % of GDP Debt of the general government according to the Maastricht definition - 4th quarter
2015
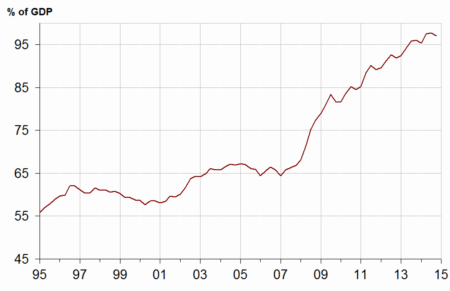
At the end of Q4 2015, the Maastricht debt amounted to € 2,096.9 billion, a € 8.8 billion decrease in comparison to Q3 2015. It accounted for 95.7 % of GDP, 1.3 points lower than the Q3 2015's level. On the contrary, the net public debt increased (€ +9.6 billion).
- The Maastricht debt decreased by €8.8 billion compared to the previous quarter
- State, Social security funds and central agencies debts went down
- Local government debt went up sharply
- In Q4 2015, the net public debt increased by 9.6 billion
- The overall value of quoted shares and mutual fund shares rose slightly

Warnings: Quarterly debt figures are based on an accounting data source less exhaustive than the annual accounts. Results may therefore be updated during several quarters.
Quarterly debt variations alone are not sufficient to forecast the deficit for the current quarter. To obtain the deficit from the change in Maastricht gross public debt, net acquisitions of financial assets and other accounts receivable and payable must also be taken into consideration.
The Maastricht debt decreased by €8.8 billion compared to the previous quarter
At the end of Q4 2015, the Maastricht debt amounted to € 2,096.9 billion, a € 8.8 billion decrease in comparison to Q3 2015. It accounted for 95.7 % of GDP, 1.3 points lower than the Q3 2015's level. On the contrary, the net public debt increased (€ +9.6 billion).
State, Social security funds and central agencies debts went down
In the fourth quarter of 2015, the State contribution to the debt decreased by € 11.6 billion. Short-term and long-term negotiable debt both went down (€ −7.2 billion and € −5.1 billion). At the same time, the total amounts of long term loans increased by € 1.2 billion.
Central agencies contribution diminished by € −3.1 billion of which € −2.1 billion from the Fonds de garantie des dépôts et de résolution exiting the general government perimeter in 2015. The Caisse Nationale des Autoroutes paid off € 1.1 billion of its debt. CSPE contribution to debt went down (€ −0.8 billion). In the same time, both Bpifrance and the Commissariat à l'énergie atomique added € 0.4 billion to their debts.
Local government debt went up sharply
The contribution of local government jumped (€ +10.6 billion). Municipalities, departments and regions respectively borrowed € 3.8 billion, € 2.3 billion and € 3.6 billion. Other local government units (intercommunal syndicates and local agencies) contributed for € +0.9 billion.
graphiqueGraphIR – General government debt under the Maastricht treaty (% of GDP) (*)
tableauTableauA – General government debt under the Maastricht treaty by sub-sector and by category
| 2014Q4 | 2015Q1 | 2015Q2 | 2015Q3 | 2015Q4 | |
|---|---|---|---|---|---|
| General Government | 2,040.3 | 2,091.9 | 2,107.9 | 2,105.7 | 2,096.9 |
| % of GDP | 95.3% | 97.6% | 97.8% | 97.1% | 95.7% |
| of which, by sub-sector consolidated*: | |||||
| State | 1,611.3 | 1,648.5 | 1,673.9 | 1,672.7 | 1,661.2 |
| Central Agencies | 22.7 | 22.1 | 22.1 | 22.1 | 18.9 |
| Local Government | 189.5 | 188.7 | 187.5 | 185.9 | 196.5 |
| Social security funds | 216.7 | 232.5 | 224.4 | 225.0 | 220.3 |
| of which, by category | |||||
| Currency and deposits | 40.1 | 38.3 | 41.0 | 41.7 | 39.3 |
| Securities other than shares | 1,705.0 | 1,762.5 | 1,778.1 | 1,774.8 | 1,760.7 |
| short-term | 196.6 | 213.6 | 191.7 | 189.7 | 177.2 |
| long-term | 1,508.4 | 1,548.9 | 1,586.4 | 1,585.1 | 1,583.5 |
| Loans | 295.1 | 291.1 | 288.8 | 289.2 | 296.9 |
| short-term | 11.8 | 17.6 | 15.2 | 14.0 | 14.6 |
| long-term | 283.4 | 273.5 | 273.6 | 275.2 | 282.3 |
- (*) Explanations in the box "For more details"
- Source: National Accounts 2010 basis − INSEE, DGFiP, Banque de France
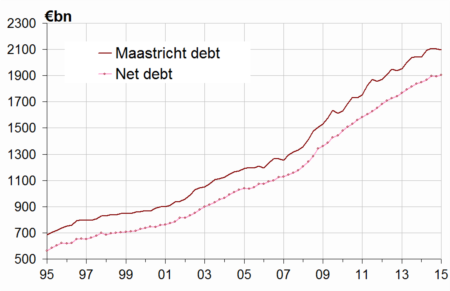
In Q4 2015, the net public debt increased by 9.6 billion
At the end of Q4 2015, the net public debt reached € 1,904.1 billion (equivalent to 86.9 % of GDP versus to 87.4 % in Q3 2015), a € 9.6 billion rise compared to the previous quarter. The € +18.4 billion gap between changes in net and gross debt is mainly explained by a significant fall of the State's cash position (€ −16.0 billion) and a more moderate decline of the cash position of social security funds (€ −1.8 billion). On the contrary, local government cash position grew by € 1.1 billion. Loans for € 1.1 billion are paid off to the Caisse nationale des autoroutes. Furthermore, FRR (Fonds de réserve pour les retraites) sold € 1.0 billion of debt securities to entities outside the scope of general government.
tableauTableauB – General government net debt by sub-sector
| 2014Q4 | 2015Q1 | 2015Q2 | 2015Q3 | 2015Q4 | |
|---|---|---|---|---|---|
| General government | 1,850.6 | 1,867.6 | 1,895.9 | 1,894.5 | 1,904.1 |
| The State | 1,510.3 | 1,518.1 | 1,551.8 | 1,553.8 | 1,556.7 |
| Central Agencies | 6.3 | 6.2 | 5.8 | 5.6 | 2.9 |
| Local government | 177.3 | 176.3 | 175.1 | 173.6 | 184.0 |
| Social security funds | 156.7 | 167.1 | 163.2 | 161.6 | 160.5 |
graphiqueGraph_dette_nette – Maastricht gross debt and net debt
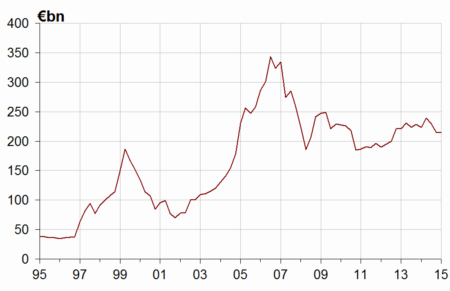
The overall value of quoted shares and mutual fund shares rose slightly
In Q4 2015, the value of quoted shares and mutual fund shares held by general government units went up to € 215.7 billion, a € 1.1 billion increase compared to Q3 2015. The State sold € 0.8 billion of SAFRAN shares. EDF shares depreciation is offset by the rise in both Renault and Engie shares' prices. FRR bought € 0.7 billion of quoted shares. The value of mutual fund shares held increased by € 0.7 billion, mainly due to movements in securities holdings by social securities funds
tableauTableauC – General government holdings of quoted shares and mutual fund shares
| 2014Q4 | 2015Q1 | 2015Q2 | 2015Q3 | 2015Q4 | |
|---|---|---|---|---|---|
| General government | 223.3 | 239.1 | 230.3 | 214.6 | 215.7 |
| The State | 75.5 | 75.5 | 71.9 | 63.6 | 63.1 |
| Central Agencies | 30.4 | 35.0 | 33.9 | 31.2 | 28.3 |
| Local government | 0.2 | 0.2 | 0.2 | 0.2 | 0.2 |
| Social security funds | 117.2 | 128.4 | 124.3 | 119.6 | 124.2 |
graphiqueGraph_F5 – General government holdings of quoted shares and mutual fund shares
Pour en savoir plus
