


 9 February 2016
2016- n° 33In manufacturing industry, business managers forecast that investment will increase
in 2016 after a slight decrease in 2015 Industrial investment survey - January 2016
9 February 2016
2016- n° 33In manufacturing industry, business managers forecast that investment will increase
in 2016 after a slight decrease in 2015 Industrial investment survey - January 2016
Surveyed in January 2016, the business managers in industry announced that their investment decreased by 2% in 2015 in nominal terms. The estimation given in October 2015 has been lowered by 3 points. Investment has been revised downwards mainly in the food and beverage sector (-7 points).
Surveyed in January 2016, the business managers in industry announced that their investment decreased by 2% in 2015 in nominal terms. The estimation given in October 2015 has been lowered by 3 points. Investment has been revised downwards mainly in the food and beverage sector (−7 points).
graphiqueGraph1_ang – Annual nominal change in investment in manufacturing industry
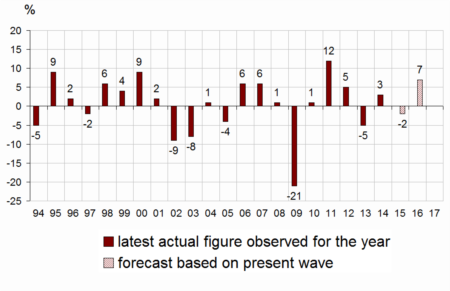
- Source: INSEE - Industrial investment survey
For 2016, business managers have revised upwards their investment forecast to +7%
For 2016, business leaders in industry forecast an increase of 7% in their equipment spending compared with 2015. They have revised by 4 points upwards their previous estimate given in October 2015. This upward revision is slightly more important than the average revision observed at that moment of the year (+3,5 points between 2004 and 2015). It is notably sharp for the sector of electrical and electronic and machine equipment (+9 points) and that of transport equipment (+6 points).
tableauTab1_ang – Real annual investment growth
| NA* : (A17) and [A38] | 2015 | 2016 | ||
|---|---|---|---|---|
| forecast Oct.15 | estimate Jan.16 | forecast Oct.15 | forecast Jan.16 | |
| C : Manufacturing industry | 1 | –2 | 3 | 7 |
| (C1): Manufacture of food products and beverages | 1 | –7 | 7 | 11 |
| (C3): Electrical and electronic equipment; machine equipment | –4 | –3 | 9 | 18 |
| (C4): Manufacture of transport equipment | 5 | 2 | –3 | 3 |
| [CL1]: Motor vehicles | –2 | 0 | –3 | 3 |
| (C5): Other manufacturing | 1 | –1 | 2 | 4 |
| Total sectors (C3-C4-C5) | 1 | 0 | 2 | 6 |
- How to read this table: In manufacturing industry, business managers surveyed in January 2016 have announced a nominal investment decrease of 2% in 2015 comparing to 2014 and forecast a nominal investment increase of 7% in 2016 comparing to 2015.
- * The codes correspond to the levels of aggregation (A17) and [A38] of the "NA" aggregate classification based on the French Classification of activities NAF rev.2.
- Source: INSEE - Industrial investment survey
More industrial leaders forecast an increase in their investment in H1 2016
In January 2016, far more industrial leaders reported a rise in their investment between H1 and H2 2015, rather than a fall. The corresponding balance of opinion has reached its highest level since 2010. For H1 2016, business managers who forecast an increase in their investment are also more numerous than those who anticipate a drop. However, this difference has decreased: the balance of opinion on planned investment is lower than that of July 2015.
graphiqueGraph2_ang – Opinion of industrials regarding six-month change in investment (second estimation)
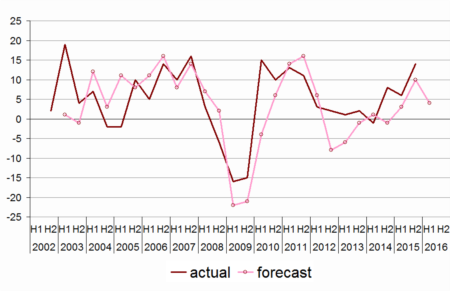
- Source: INSEE - Industrial investment survey
The investment revision indicator has risen anew
The investment revision indicator has increased anew after a decrease during H2 2015.
Indeed, business managers were more numerous to revise their expectations for 2016 upwards rather than downwards. This indicator is calculated from investment amounts reported in at each survey by business leaders in manufacturing industry (excluding manufacture of food products and beverages and coke and that of refined petroleum products).
graphiqueGraphIR_ang – Investment revision indicator
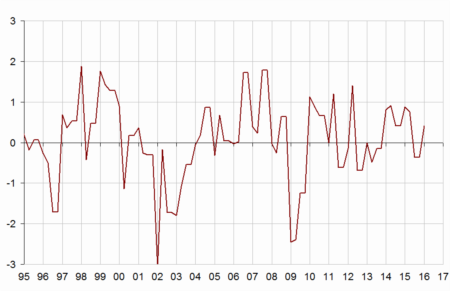
- Source: INSEE - Industrial investment survey
Documentation
Methodology (pdf,34 Ko)
Pour en savoir plus
Time series : Industry – Investment
