


 18 February 2016
2016- n° 41Consumer prices decreased by 1.0% in January 2016, they were up 0.2% year-on-year Consumer price index - final results - January 2016
18 February 2016
2016- n° 41Consumer prices decreased by 1.0% in January 2016, they were up 0.2% year-on-year Consumer price index - final results - January 2016
Monthly change: −1.0%; year-on-year: +0.2% In January 2016, the Consumer Prices Index (CPI) fell by 1.0% after an increase by 0.2% in December. Seasonally adjusted, it diminished by 0.2% after a stability in December. Year-on-year, it grew by 0.2% in January 2016, as in the previous month. The downturn in the CPI in January came mainly from the seasonal fall of manufactured product prices during the winter sale period and from the drop in prices of services tourism-related. Furthermore, petroleum product prices decreased again.

Warning : The Consumer price indexes are now published with reference year 2015 = 100. Further information can be found on the web page of this indicator.
Monthly change: −1.0%; year-on-year: +0.2%
In January 2016, the Consumer Prices Index (CPI) fell by 1.0% after an increase by 0.2% in December. Seasonally adjusted, it diminished by 0.2% after a stability in December. Year-on-year, it grew by 0.2% in January 2016, as in the previous month.
The downturn in the CPI in January came mainly from the seasonal fall of manufactured product prices during the winter sale period and from the drop in prices of services tourism-related. Furthermore, petroleum product prices decreased again.
Winter sales drove down manufactured good prices
In January 2016, the manufactured product prices were broadly down 3.0% due to the winter sales. Year-on-year, they were almost unchanged (−0.1% after −0.3% in December 2015). Thus, as every year, clothing and footwear prices fell sharply in January (−16.7%; −0.6% year-on-year). To a lesser extent, winter sales contributed to the decrease in prices of many other products, as household textiles, travel goods and other carriers of personal effects (−4.3%; +0.2% year-on-year), furniture and furnishings (−3.1%; +0.4% year-on-year), jewelry, clocks and watches (−1.3%; +2.4% year-on-year) as well as domestic appliances (−1.1%; −0.3% year-on-year).
tableauTableau1IR_English – Detailed figures for various groups
| Items | Weight | Index | Percentage change | |
|---|---|---|---|---|
| 2016 | Jan. 2016 | m-on-m change | y-on-y change | |
| a) All households | ||||
| OverAll | 10000 | 99.08 | −1.0 | 0.2 |
| Overall SA* | 10000 | 99.81 | −0.2 | 0.2 |
| Food | 1615 | 99.93 | −0.1 | 0.4 |
| Fresh food | 217 | 98.74 | −0.4 | 1.8 |
| Other food | 1398 | 100.12 | 0.0 | 0.2 |
| Tobacco | 195 | 100.04 | 0.0 | 0.3 |
| Manufactured products | 2651 | 97.84 | −3.0 | −0.1 |
| Clothing and footwear | 414 | 87.77 | −16.7 | −0.6 |
| Medical products | 466 | 98.28 | −0.1 | −3.7 |
| Other manufactured products | 1771 | 99.81 | −0.5 | 0.6 |
| Energy | 773 | 95.02 | −1.2 | −3.8 |
| Petroleum products | 419 | 89.38 | −3.6 | −7.4 |
| Services | 4766 | 100.15 | −0.1 | 1.1 |
| Actual rentals and services for dwellings | 768 | 100.53 | 0.0 | 0.6 |
| Medical services | 598 | 100.06 | −0.3 | 0.0 |
| Transport | 279 | 96.20 | −3.7 | −1.7 |
| Communication | 245 | 99.99 | −0.1 | 1.0 |
| Other services | 2876 | 100.46 | 0.2 | 1.7 |
| Total except rents and tobacco | 9183 | 98.99 | −1.0 | 0.2 |
| Total except tobacco | 9805 | 99.07 | −1.0 | 0.2 |
| b) Urban working-class households or households of employees | ||||
| All products excluding tobacco | 9704 | 99.00 | −1.0 | 0.1 |
| c) Households that belong to the lowest equivalized disposable income quintile - France | ||||
| All products excluding tobacco | 9696 | 98.85 | −1.1 | 0.0 |
- Source: INSEE - Consumer Price Indexes - France excluding Mayotte
- *: seasonally adjusted
Seasonal decline in service prices
In January 2016, service prices diminished slightly month-on-month (−0.1% after +0.6% in December) and rose by 1.1% year-on-year. In fact, after the end-of-year holidays, tourism-related service prices fell back seasonally in January, particularly airfares (−11.4%; −3.7% year-on-year), package holidays (−5.4%) and accommodation services (−2.1%; +3.6% year-on-year). On the opposite, as every year, many fees have been risen in January, in particular postal rates (+3.8%), financial services (+1.7%; +2.1% year-on-year) as well as insurance fees (+1.2%; +2.6% year-on-year).
Energy prices decreased again
Energy prices continued to drop in January 2016 (−1.2%, as in December ; −3.8% year-on-year) due to the ongoing downward trend in petroleum product prices (−3.6% in January ; −7.4% year-on-year). Prices of heating fuels tumbled again (−8.3%; −17.2% year-on-year). The fall in motor gas prices was cushioned by higher taxes on these products. Moreover, due to rises in duties, prices of town gas were up by 1.0% in January (−8.2% year-on-year) and those of electricity by 2.2% (+4.1% year-on-year).
Slightly cheaper fresh food stuffs
In January 2016, food prices declined again slightly (−0.1% month-on-month after −0.3% in December), as fresh foodstuff prices decreased moderately (−0.4%), in particular for fresh fruits (−2.5%). Prices of fresh vegetables picked up softly (+0.7%) while fresh fish prices (+3.8%) and those of fresh seafood (+2.4%) rose significantly. Excluding fresh foodstuffs, food prices were unchanged, as in the previous month. Year-on-year, they were up 0.2%, as in December.
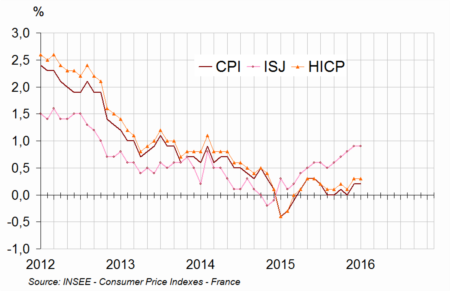
Stability over a year of core inflation and of HICP inflation
In January 2016, the core inflation indicator (ISJ) rose by 0.1% as in December 2015. Year-on-year, it grew by 0.9%, as in December 2015. The Harmonized Index of Consumer Prices (HICP) was down 1.1% month-on-month in January. Year on year, it rose by 0.3%, as in the previous month.
graphiqueGraphiqueIR_English – Consumer price index (CPI), core inflation (ISJ) and Harmonised Indices of Consumer Prices (HICP) year-on-year changes
tableauTableau2IR_English – Detailed figures for Core inflation* and HICP**
| Items | Weight | Index | Percentage change | |
|---|---|---|---|---|
| 2016 | Jan. 2016 | m-on-m change | y-on-y change | |
| Core inflation - All items | 6075 | 100.40 | 0.1 | 0.9 |
| Food excluding fresh products, meat, milk and exotic products | 735 | 100.13 | 0.2 | 0.0 |
| Manufactured products | 2136 | 99.67 | −0.5 | 0.6 |
| Services including actual rentals and services for dwellings | 3204 | 100.74 | 0.3 | 1.3 |
| HICP - All items | 99.03 | −1.1 | 0.3 | |
- * Core inflation indicator excludes public sector prices, the most volatile consumer prices and the tax measures. Seasonally adjusted, this index is calculated for all households in France excluding overseas departments and territories. (in French “indice d'inflation sous-jacent - ISJ)
- **HICP: Harmonised Indices of Consumer Prices are inflation figures designed for international comparison of consumer price inflation between Member states of the European Union. This index is calculated for all households in France.
- Source: INSEE - Consumer Price Indexes - France excluding Mayotte
Revisions
The CPI monthly and annual variations are inchanged from the provisional estimates released on 29th January. The HICP monthly and annual variations have been revised down by 0.1 points. The variation of the core inflation indicator (ISJ) in December 2015 was revised up 0.1 points compared to the data released on 13th January 2016 due to a new estimation of seasonal adjustment parameters.
Pour en savoir plus
