


 31 March 2016
2016- n° 85In February 2016, household consumption expenditure on goods kept increasing (+0.6%) Household consumption expenditure on goods - February 2016
31 March 2016
2016- n° 85In February 2016, household consumption expenditure on goods kept increasing (+0.6%) Household consumption expenditure on goods - February 2016
In February 2016, household consumption expenditure on goods rose by 0.6% in volume* (after +1.0% in January and +1.1% in December 2015). It exceeded its previous highest level reached at the beginning of 2011. Food products purchases bounced back. Expenditure on household durables sped up. Expenditure on energy kept on growing, even if it slowed. The overall increase was dampened by a sharp downturn in the expenditure on textile-clothing after the winter sales.
In February 2016, household consumption expenditure on goods rose by 0.6% in volume* (after +1.0% in January and +1.1% in December 2015). It exceeded its previous highest level reached at the beginning of 2011. Food products purchases bounced back. Expenditure on household durables sped up. Expenditure on energy kept on growing, even if it slowed. The overall increase was dampened by a sharp downturn in the expenditure on textile-clothing after the winter sales.
Food products: marked rebound
Consumption of food products bounced back significantly in February (+1.5%) after having decreased the previous month (−0.7%). Purchases of meat and beverages contributed most to this upswing.
Energy: slowing down
In February, expenditure on energy grew at a slower pace than in January (+1.2% after +3.5%). After a marked rebound in January as a backlash against an unusually mild December, expenses on gas and electricity for heating purposes increased moderately in February, the deviation of the temperatures to seasonal norms remaining close to that of January. In addition, consumption of refined products bounced back (+1.4% after −3.7%).
Engineered goods: slight downturn
In February, purchases of engineered goods fell back slightly (−0.3%) after two months of sharp growth, due to lower expenses on textile-clothing.
Durables: rising for the fourth consecutive month
In February, consumption of durables increased anew (+1.1%), after a near stability in January (+0.1%). This acceleration comes mainly from a marked growth in the expenditure on household durables (+3.1%), notably in electronics products, for the second consecutive month. Car purchases picked up moderately (+0.5% after −0.1%).

* Volumes are chained and all figures are trading days and seasonally adjusted.
graphiquegraph1_new_ang – Total consumption of goods
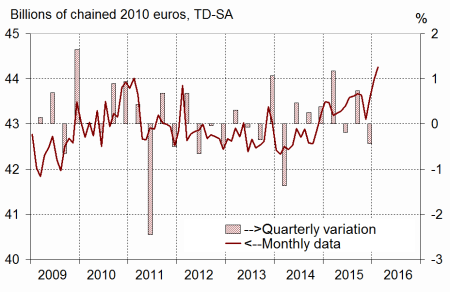
- Source: INSEE
graphiquegraph2_new_ang – Food and engineered goods
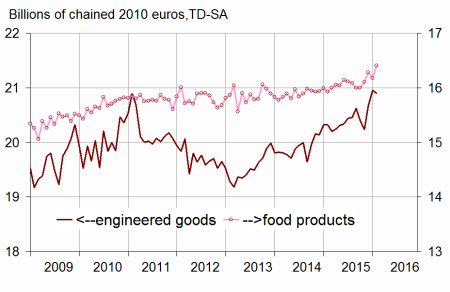
- Source: INSEE
graphiquegraph3_new_ang – Energy
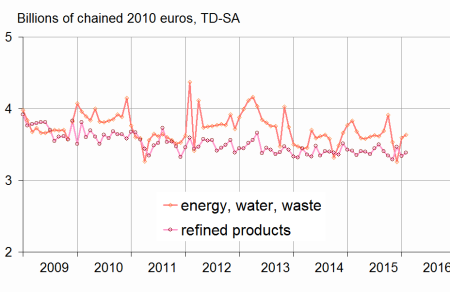
- Source: INSEE
Textile-clothing: substantial downturn
In February, expenditure on textile-clothing fell back markedly (−4.4%), after two months of growth, particularly in January (+5.7%) because of the winter sales. The decline results mainly from lower shoes purchases.
Other engineered goods: on the rise again
In February, expenditure on other engineered goods climbed for the third consecutive month (+0.5%, as in January), particularly driven by hardware purchases.
The variation in January 2016 is revised upwards
The variation of household expenditure on goods in January 2016 has been revised upwards by 0.4 points: it now stands at +1.0%, instead of +0.6%. Indeed, since the previous publication, new information has been integrated, mainly regarding textile and clothing, and the seasonal adjustment coefficients have been updated.
graphiquegraph4_new_ang – Breakdown of engineered goods
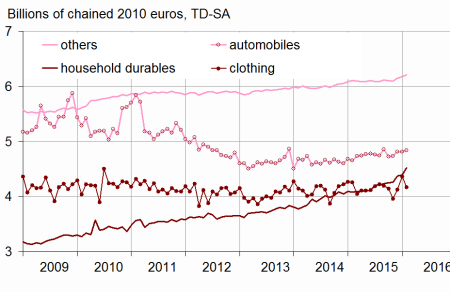
- Source: INSEE
- Source: INSEE
tableautab1_eng – Household consumption expenditure on goods
| Weight (1) | Dec. 2015 | Jan. 2016 | Feb. 2016 | Feb. 16 / Feb. 15 | Q / Q-1 (2) | |
|---|---|---|---|---|---|---|
| Food products | 38 | 1.1 | –0.7 | 1.5 | 3.1 | 1.6 |
| Engineered goods | 44 | 2.2 | 1.4 | –0.3 | 2.8 | 2.1 |
| - Inc. Durables | 21 | 2.0 | 0.1 | 1.1 | 5.8 | 2.2 |
| - Automobiles | 11 | 1.8 | –0.1 | 0.5 | 3.9 | 1.1 |
| - Household durables | 7 | 2.6 | 0.5 | 3.1 | 10.8 | 4.3 |
| - Inc. Textile-clothing | 10 | 4.3 | 5.7 | –4.4 | –2.1 | 2.9 |
| - Inc. Other engineered goods | 13 | 0.9 | 0.5 | 0.5 | 1.7 | 1.2 |
| Energy | 18 | –1.7 | 3.4 | 1.2 | –3.2 | –2.4 |
| - Inc. Energy, water, waste | 10 | –7.9 | 10.5 | 1.0 | –5.3 | –5.9 |
| - Inc. Refined Products | 9 | 5.4 | –3.7 | 1.4 | –0.8 | 1.6 |
| Total | 100 | 1.1 | 1.0 | 0.6 | 1.8 | 1.1 |
| - Inc. Manufactured goods | 85 | 2.0 | 0.1 | 0.5 | 2.6 | 1.8 |
- (1) Weighting in the consumption expenditure on goods in value
- (2) Last three months / previous three months
Documentation
Methodology (pdf,23 Ko)
Pour en savoir plus
