


 24 March 2016
2016- n° 77In March 2016, the business climate recovers in retail trade and in trade and repair
of motor vehicles Monthly survey of retailing - March 2016
24 March 2016
2016- n° 77In March 2016, the business climate recovers in retail trade and in trade and repair
of motor vehicles Monthly survey of retailing - March 2016
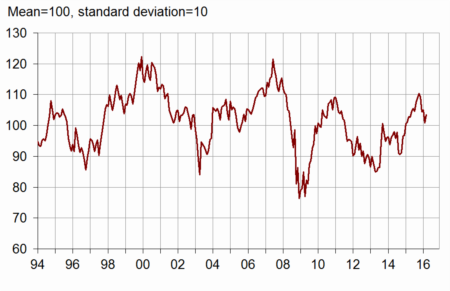
In retail trade and in trade and repair of motor vehicles, the business climate has recovered according to the managers surveyed in March 2016. The composite indicator that measures it has won three points and stands at 104. It has been above its long term average (100) since the beginning of 2015.
In retail trade and in trade and repair of motor vehicles, the business climate has recovered according to the managers surveyed in March 2016. The composite indicator that measures it has won three points and stands at 104. It has been above its long term average (100) since the beginning of 2015.
graphiquegraph_indsynt_en – Business climate synthetic indicator
A little more optimism concerning activity
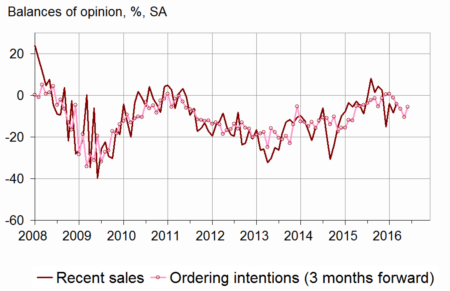
In retail trade and in trade and repair of motor vehicles, more managers than in February have indicated a rise in their past and expected activity. Each of the three balances concerning recent and expected sales and ordering intentions has slightly picked up and has returned to above its average. General business outlook has stabilised above its average.
Stocks are estimated virtually stable, moderately above their standard level.
More managers than on the last interrogation have declared decreases in selling prices over the past few months. However, fewer of them anticipate price falls in the next few months.
The cash position has slightly improved, standing at its average from now on.
graphiqueGraph_ventes_ic_en – Recent sales and ordering intentions
tableautab1_en – Global data
| Ave. (1) | Dec. 15 | Jan. 16 | Feb. 16 | Mar. 16 | |
|---|---|---|---|---|---|
| Business climate | 100 | 104 | 105 | 101 | 104 |
| General business outlook | –30 | –20 | –16 | –21 | –21 |
| Recent sales | –7 | –15 | –4 | –8 | –4 |
| Expected sales | –3 | –4 | 5 | –5 | –1 |
| Ordering intentions | –9 | –4 | –7 | –10 | –6 |
| Stocks | 10 | 15 | 15 | 11 | 12 |
| Past selling prices (2) | –7 | –4 | –12 | ||
| Expected selling prices | –3 | –6 | –6 | –6 | –4 |
| Cash position (2) | –15 | –17 | –15 | ||
| Workforce size: recent trend | –1 | –3 | 1 | –4 | –5 |
| Workforce size: future trend | –3 | –4 | –5 | –8 | –7 |
- (1) Average since 1991 (2004 for recent and expected sales and ordering intentions).
- (2) Bi-monthly question (odd-numbered months).
- Source: monthly survey in retail trade and in trade and repair of motor vehicles - INSEE
Employment prospects remain grim
Each of both balances concerning recent and expected workforce trends is practically stable, below its mean level.
Revisions
The business climate of February 2016 has been revised downward by two points since its first estimate. This decrease is due to late answers from businesses which have been taken into account.
Retail trade
The balances concerning past and expected activity recover in non-specialised trade
More retailers of non-specialised trade than in February have declared an increase in their past and expected sales and in their ordering intentions. Each of the three balances has recovered, moving up closer to its average. Conversely, in specialised trade, slightly more retailers have declared that their past and expected activity has declined. However the balances concerning past sales and ordering intentions remain close to their average.
Overall, stocks are estimated higher, but remain close to their standard level.
In both non-specialised and specialised trade, more retailers than on the last interrogation have pointed out decreases in prices over the past few months. Fewer non-specialised traders than in February foresee price falls, while as many specialised retailers do.
The cash-flow situation has been estimed slightly easier than on average in non-specialised trade, but a little more difficult in specialised one.
Trade and repair of motor vehicles
Activity balances remain above their average
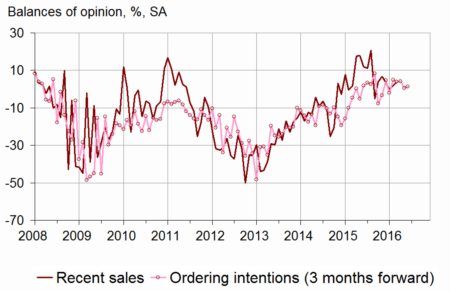
As many motor vehicle traders than in February have indicated a rise in their past and expected activity. The three balances concerning past and expected sales and ordering intentions have remained virtually stable, above their long term average for practically 18 months.
graphiquegraph_ventes_ic_auto_en – Recent sales and ordering intentions in motor vehicles
Stocks have been estimated lower and stand close to their standard level.
Both balances concerning past and expected prices have declined.
Th cash position is considered easier than on average.
tableautab2_en – Detailed data
| Ave. (1) | Dec. 15 | Jan. 16 | Feb. 16 | Mar. 16 | |
|---|---|---|---|---|---|
| Retail trade - Global data | |||||
| Recent sales | –6 | –23 | –5 | –12 | –7 |
| Expected sales | 0 | –6 | 3 | –7 | –3 |
| Ordering intentions | –7 | –9 | –11 | –14 | –8 |
| Stocks | 9 | 13 | 13 | 8 | 10 |
| Past selling prices (2) | –8 | –8 | –16 | ||
| Expected selling prices | –5 | –10 | –11 | –10 | –5 |
| Cash position (2) | –13 | –15 | –15 | ||
| Workforce size: recent trend | 1 | –2 | 2 | –2 | –3 |
| Workforce size: future trend | –2 | –5 | –6 | –7 | –9 |
| Non-specialised retail trade | |||||
| Recent sales | –2 | –26 | 2 | –17 | –4 |
| Expected sales | 6 | –3 | 6 | –3 | 3 |
| Ordering intentions | 1 | –4 | –13 | –14 | 1 |
| Stocks | 7 | 15 | 17 | 9 | 13 |
| Past selling prices (2) | –9 | –10 | –16 | ||
| Expected selling prices | –5 | –10 | –13 | –14 | –6 |
| Cash position (2) | –7 | –7 | –5 | ||
| Specialised retail trade | |||||
| Recent sales | –11 | –19 | –15 | –7 | –10 |
| Expected sales | –8 | –12 | –4 | –11 | –12 |
| Ordering intentions | –17 | –14 | –13 | –14 | –18 |
| Stocks | 13 | 12 | 9 | 6 | 6 |
| Past selling prices (2) | –8 | –10 | –14 | ||
| Expected selling prices | –5 | –11 | –8 | –5 | –5 |
| Cash position (2) | –23 | –25 | –26 | ||
| Trade and repair of motor cars and motorcycles | |||||
| Recent sales | –10 | 3 | 0 | 2 | 4 |
| Expected sales | –8 | 6 | 8 | 8 | 7 |
| Ordering intentions | –12 | 4 | 4 | 1 | 1 |
| Stocks | 15 | 18 | 21 | 21 | 17 |
| Past selling prices (2) | 1 | 5 | 3 | ||
| Expected selling prices | 4 | 0 | –2 | 4 | 0 |
| Cash position (2) | –25 | –19 | –16 | ||
| Workforce size: recent trend | –9 | –11 | –9 | –9 | –13 |
| Workforce size: future trend | –7 | –4 | –5 | –1 | –1 |
- (1) Average since 1991 (2003 for trade and repair of motor vehicles and 2004 for recent and expected sales and ordering intentions).
- (2) Bi-monthly question (odd-numbered months).
- Source: monthly survey in retail trade and in trade and repair of motor vehicles - INSEE
Documentation
Methodology (pdf,129 Ko)
Pour en savoir plus
