


 12 November 2015
2015- n° 274In October 2015, prices of frequently purchased goods were stable in hyper and supermarkets Price Index in large and predominantly-food stores - October 2015
12 November 2015
2015- n° 274In October 2015, prices of frequently purchased goods were stable in hyper and supermarkets Price Index in large and predominantly-food stores - October 2015
In October 2015, prices of frequently purchased goods remained broadly unchanged in hyper and supermarkets month-on-month, after a decline by 0.1% in September.
In October 2015, prices of frequently purchased goods remained broadly unchanged in hyper and supermarkets month-on-month, after a decline by 0.1% in September.
Excluding hyper and supermarkets, they were up somewhat (+0.2% after –0.1% in September). As a result, considering all stores, prices of frequently purchased goods increased sligthly (+0.1% after –0.1% in September).
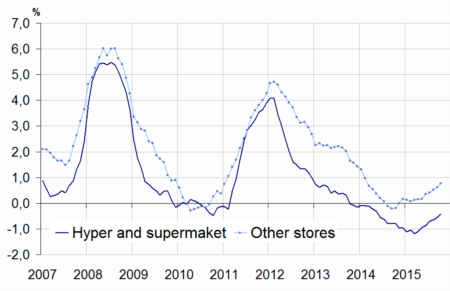
Year-on-year, the fall in price of frequently purchased goods eased in hyper and supermarkets
In October 2015, in hyper and supermarkets, prices of frequently purchased goods were less expensive than a year ago (–0.4%). This price fall eased after bottoming out in March 2015 (–1.2% year-on-year). In October 2014, these prices had decreased by 0.8% year-on-year.
In large and predominantly food stores, prices of frequently purchased goods decreased also by 0.4% year-on-year (after –0.6% in September).
Considering all stores, prices of frequently purchased goods were stable compared with the same month one year ago (after –0.2% year-on-year in September 2015 and –0.6% in October 2014). Indeed, excluding hyper and supermarkets, prices of frequently purchased goods sped up, rising by 0.8% year-on-year in October after +0.6% in September and +0.5% in August.
graphiqueGraphique1English – Frequently purchased goods price indexes year-on-year change %
- Source: INSEE - Consumer Price Indexes
graphiqueGraphique2English – Frequently purchased goods price indexes
- Source: INSEE - Consumer Price Indexes
tableauTableau1English – Prices of frequently purchased goods
| Index | Changes (%) compared to | ||
|---|---|---|---|
| October 2015 | last month (m-o-m) | 12 months before (y-o-y) | |
| Hyper-and-Supermarkets (A) | 125.50 | 0.0 | –0.4 |
| Large and predominantlyfood stores (A + neighbourhood stores) | 126.56 | 0.0 | –0.4 |
| Other stores | 136.38 | 0.2 | 0.8 |
| All stores excluding hyper and supermarkets | 128.89 | 0.1 | 0.0 |
- Source: INSEE - Consumer Price Indexes
tableauTableau2English – Prices of frequently purchased goods detailed by main items
| Index | Changes (%) compared to | ||
|---|---|---|---|
| October 2015 | last month (m-o-m) | 12 months before (y-o-y) | |
| Food and beverages(excluding fresh foodstuffs) | 126.49 | 0.0 | –0.3 |
| - Meat | 139.98 | 0.1 | 0.2 |
| - Beverages | 123.83 | –0.1 | 0.0 |
| - Other food products | 120.62 | 0.0 | -0.6 |
| Clearing and personal care products | 121.31 | –0.1 | –1.2 |
| Total Hyper-and-Supermarkets | 125.50 | 0.0 | -0.4 |
- Source: INSEE - Consumer Price Indexes
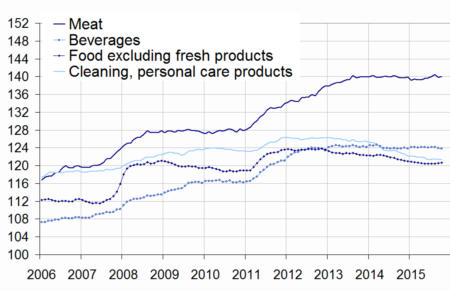
Excluding fresh foodstuffs, food prices were stable in hyper and supermarkets
In October 2015, prices of food excluding fresh foodstuffs were broadly unchanged in hyper and supermarkets. Year-on-year, they decreased by 0.3% after –0.4% in September and –0.5% in July and August.
Prices of meat were slightly up (+0.1%; +0.2% year-on-year). On the other hand, beverage prices decreased again compared with the previous month (–0.1% after –0.2% in September); they remained unchanged year-on-year.
Prices of other food products (excluding fresh foodstuffs) were stable in hyper and supermarkets after a slight increase during the previous month (+0.1%). Year-on-year, their decrease lessened (–0.6% after –0.7% in September and –1.0% in August). In October 2014, they had been down 0.9% year-on-year.
Slighter decline in prices of cleaning and personal care products year-on-year
In October 2015, prices of cleaning and personal care products diminished slightly again in hyper and supermarkets (–0.1% as in September). Year-on-year, they were down –1.2% in October, at a lower pace than in the last few months (–1.4% in September and –1.5% in August). In October 2014, they had fallen by 2.0% year-on-year.
Pour en savoir plus
