


 17 September 2015
2015- n° 228In June 2015, producer cost indices for construction were stable Costs of production indices in construction - June 2015
17 September 2015
2015- n° 228In June 2015, producer cost indices for construction were stable Costs of production indices in construction - June 2015
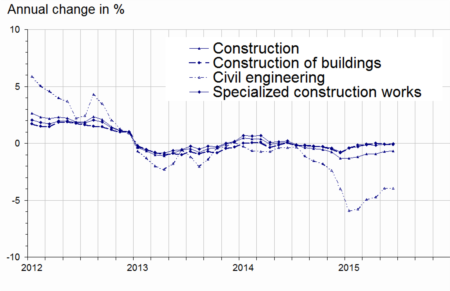
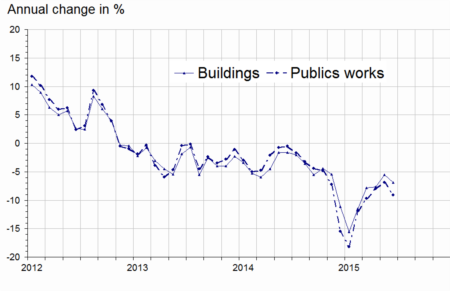
In June 2015, production costs in construction were stable (after +0.2% in May), being unchanged or virtually unchanged in the different fields of activity. Over a year, the production costs in construction were down (–0.7%) due to a sharp decrease in civil engineering (–3.9%), while they were almost stable in the construction of buildings (–0.1%) and stable in specialised construction works.
In June 2015, production costs in construction were stable (after +0.2% in May), being unchanged or virtually unchanged in the different fields of activity. Over a year, the production costs in construction were down (–0.7%) due to a sharp decrease in civil engineering (–3.9%), while they were almost stable in the construction of buildings (–0.1%) and stable in specialised construction works.
tableautablo1 – Producer cost indices for construction
| NAF | Heading | Weights (in %) | June 15/ May 15 | June 15/ June 14 |
|---|---|---|---|---|
| F | Construction | 100.0 | - 0.0 | - 0.7 |
| 41.2 | Construction of buildings | 10.1 | - 0.1 | - 0.1 |
| 42 | Civil engineering | 16.2 | + 0.0 | - 3.9 |
| 43 | Specialised construction works | 73.7 | - 0.0 | - 0.0 |
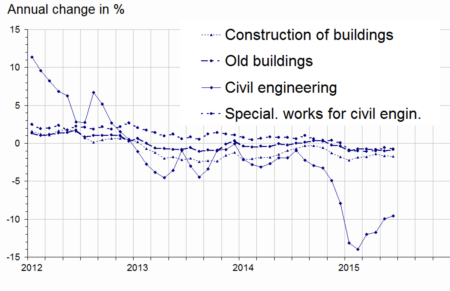
| 43BT | Buildings | 64.2 | - 0.0 | + 0.4 |
| 43BTC | New buildings | 24.6 | - 0.1 | - 0.0 |
| 43BTR | Existing buildings | 39.6 | + 0.0 | + 0.6 |
| 43TP | Specialised works for civil engineering | 9.5 | - 0.0 | - 2.8 |
| BT | Buildings (41.2 + 43BT) | 74.3 | - 0.0 | + 0.3 |
| TP | Public works (42 + 43TP) | 25.7 | - 0.0 | - 3.5 |
- Source: INSEE
tableautablo2 – Items of producer cost indices for construction
| Costs | items | Q1 15 / Q4 14 | Q2 15 / Q1 15 | June 15/ May 15 | June 15/ June 14 | |
|---|---|---|---|---|---|---|
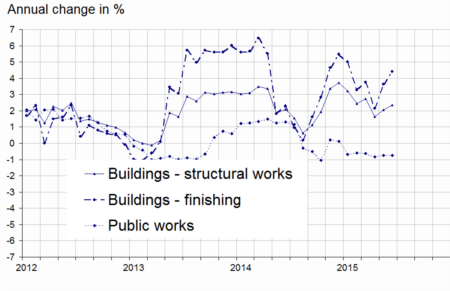
| Equipment | Buildings - structural works | + 0.2 | + 0.1 | + 0.3 | + 2.3 | |
| Buildings - finishing | + 0.3 | 0.0 | + 0.6 | + 4.4 | ||
| Public works | + 0.5 | - 0.1 | 0.0 | - 0.7 | ||
| Labour | Labour costs in construction | + 0.7 | - 0.4 | 0.0 | + 1.1 | |
| Energy | Buildings | - 5.1 | + 4.3 | - 1.3 | - 6.9 | |
| Public works | - 4.6 | + 5.7 | - 1.6 | - 9.1 | ||
| Material | Construction of buildings | - 0.8 | - 0.1 | - 0.4 | - 1.7 | |
| Existing buildings | - 0.7 | - 0.3 | - 0.0 | - 0.8 | ||
| Civil engineering | - 8.9 | + 2.0 | + 0.3 | - 9.6 | ||
| Specialised works for civil engineering | - 0.4 | - 0.1 | - 0.4 | - 0.8 | ||
| Services | Construction | + 0.4 | + 0.2 | + 0.3 | + 0.7 | |
| Transport | Buildings | - 1.4 | + 1.3 | - 0.3 | - 1.0 | |
| Public works | - 1.3 | + 1.0 | 0.0 | - 1.0 | ||
- Source: INSEE
graphiqueGRCoutUK – Production costs in construction
- Source: INSEE
Materials
In June 2015, materials costs for construction of buildings and specialised works for civil engineering decreased (–0.4%), in particular because of the fall of ready-mixed concrete prices (–0.6%). In civil engineering, materials costs continued to rise (+0.3% after +1.4%) due to higher prices of bitumen (+2.6% in June after +6.5% in May, but –30.0% over a year).
graphiqueGRMUK – Materials costs
- Source: INSEE
Equipment
In June 2015, material costs picked up in finishing (+0.6% after 0.2%) due to higher prices of machine tools. They levelled off in public works.
graphiqueGRKUK – Equipment cost
- Source: INSEE
graphiqueGRtravailUK – Labour cost in construction
- Source: INSEE
Energy
In June 2015, energy cost fell back in construction of buildings (–1.3% after +2.1%, –6.9% over a year), due to the decrease in diesel prices. It slipped a bit more in public works (–1.6% after +1.3%; –9.1% over a year), due to a further decline in the price of heavy fuel oil.
graphiqueGRenergieUK – Energy cost
- Source: INSEE
tableaurevisionUK – Revisions of costs of production indices in construction
| Mar. 15 | Apr. 15 | May. 15 | ||
|---|---|---|---|---|
| F | Construction | /// | -0.3 | +0.1 |
| 41.2 | Construction of buildings | /// | -0.2 | /// |
| 42 | Civil engineering | /// | -0.1 | /// |
| 43 | Specialised construction works | /// | -0.3 | /// |
- Reading note: producer cost for construction between March and April 2015 published in July 2015 has been updated from +0.1% to –0.2%, that is to say a downward revision by 0.3 point, in line with the dissemination of the last values of the labour cost index.
- Source: INSEE
Pour en savoir plus
Time series : Producer cost indices for construction
