


 10 September 2015
2015- n° 219In Q2 2015, prices of second-hand dwellings were still decreasing but the transactions
started again Indexes of prices of second-hand dwellings - 2nd Quarter 2015
10 September 2015
2015- n° 219In Q2 2015, prices of second-hand dwellings were still decreasing but the transactions
started again Indexes of prices of second-hand dwellings - 2nd Quarter 2015
During the second quarter of 2015, prices of second-hand dwellings were still decreasing (–0.6% quarter-on-quarter according to provisional results, s.a. data), a little faster than in the previous quarter (–0.2%).
During the second quarter of 2015, prices of second-hand dwellings were still decreasing (–0.6% quarter-on-quarter according to provisional results, s.a. data), a little faster than in the previous quarter (–0.2%).
Year-on-year, prices of second-hand dwellings went down by 2.7%. It has been the strongest drop recorded since the beginning of the current period of price fall (middle of 2012). This drop was more important for flats (–3.1%) than for houses (–2.4%). Between the middle of 2012 and the end of 2014, on the contrary, prices of houses had fallen more than prices of flats.
In Île-de-France, the drop has been more marked since the end of 2014
In Île-de-France, prices of second-hand dwellings went on declining at a pace close to that observed since the end of 2014: –0.6% q-o-q, –2.6% y-o-y. This decrease was sharper than between the middle of 2012 and the end of 2014. There again, it was more important for flats (–3.0% y-o-y) than for houses (–1.9%).
New decrease of prices in provincial France
In provincial France, prices of second-hand dwellings declined again in the second quarter 2015 (–0.6% q-o-q, –2.8% y-o-y), after a stability in the first quarter. As in Île-de-France, the decline was more marked for flats (–3.3% y-o-y) than for houses (–2.6%).
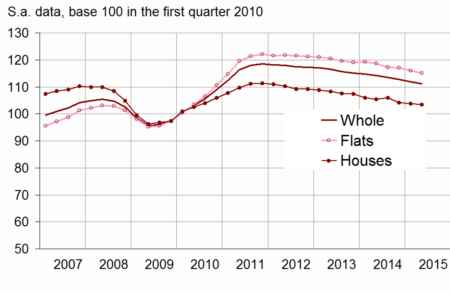
graphiqueGraphique1a – Prices of second-hand dwellings
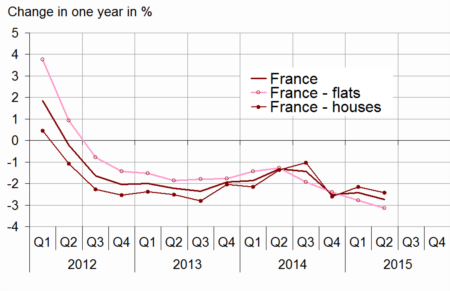
- INSEE, French notaries - Database Bien, Perval society
graphiqueGraphique2a – Prices of second-hand dwellings in Île-de-France
- INSEE, French notaries - Database Bien, Perval society
tableauTableau1a – Variation in prices of second-hand dwellings in metropolitan France
| change in | ||||||
|---|---|---|---|---|---|---|
| 3 months (S.A.) | 12 months | |||||
| 2014 Q4 | 2015 Q1 (sd) | 2015 Q2 (p) | 2014 Q4 | 2015 Q1 (sd) | 2015 Q2 (p) | |
| France | -1.2 | -0.2 | -0.6 | -2.5 | -2.4 | -2.7 |
| Flats | -0.8 | -0.5 | -0.8 | -2.4 | -2.8 | -3.1 |
| Houses | -1.6 | 0.0 | -0.4 | -2.6 | -2.1 | -2.4 |
- (p) : provisional
- (sd) : semi-definitive
- Sources: INSEE, French notaries - Database Bien, Perval society
Annual volumes of transactions: picked up
After decreasing since june 2014, the annual volume of transactions increased again in the second quarter of 2015. In june 2015, it was estimated at 716,000 over the last 12 months, against 694,000 in March 2015.
This volume of transaction remained however slightly lower than its level one year before (730,000 in June 2014, that is –1.9%).
graphiqueGraphique3a – Volume of transactions of second-hand dwellings over the last 12 months

- CGEDD, based on notarial databases and DGFiP (MEDOC)
Revisions
The index is revised to include transactions recorded after the last publication. Furthermore, for this publication, the seasonal factors for provincial France has been revised. This could marginally change the figures since the beginning of 2008. In comparison to the results released on 7th July, the change in prices in the first quarter of 2015 was revised downwards (–0.1 point) : –0.1 for houses, –0.2 for flats. The overall change in prices in Q1 2015 stood at –0.2%, instead of –0.1% (figure updated on 7th July), and +0.3% estimated on May 28th.
tableauTableau2a – Variation in prices of second-hand dwellings in metropolitan France
| Change in | ||||||
|---|---|---|---|---|---|---|
| 3 months (S.A.) | 12 months | |||||
| 2014 Q4 | 2015 Q1 (sd) | 2015 Q2 (p) | 2014 Q4 | 2015 Q1 (sd) | 2015 Q2 (p) | |
| Metropolitan France | -1.2 | -0.2 | -0.6 | -2.5 | -2.4 | -2.7 |
| - Flats | -0.8 | -0.5 | -0.8 | -2.4 | -2.8 | -3.1 |
| - Houses | -1.6 | 0.0 | -0.4 | -2.6 | -2.1 | -2.4 |
| Île-de-France | -0.7 | -0.7 | -0.6 | -2.1 | -2.5 | -2.6 |
| Provincial France | -1.5 | 0.0 | -0.6 | -2.7 | -2.4 | -2.8 |
| Flats | ||||||
| Île-de-France | -0.2 | -0.9 | -0.8 | -1.7 | -2.7 | -3.0 |
| - Paris | -0.4 | -0.7 | -0.5 | -2.3 | -2.8 | -3.1 |
| - Seine-et-Marne | -1.6 | -1.3 | -0.2 | -3.1 | -3.3 | -2.4 |
| - Yvelines | 0.3 | -2.2 | -1.3 | -0.9 | -3.1 | -4.3 |
| - Essonne | -1.6 | -0.6 | -0.3 | -3.5 | -3.8 | -3.6 |
| - Hauts-de-Seine | 0.7 | -1.1 | -1.4 | -0.3 | -2.1 | -2.7 |
| - Seine-Saint-Denis | 0.3 | -0.6 | -0.9 | -0.7 | -2.3 | -1.9 |
| - Val-de-Marne | -0.2 | -0.7 | -0.9 | -1.3 | -2.4 | -2.5 |
| - Val-d'Oise | -1.7 | -0.7 | -0.4 | -3.3 | -3.4 | -3.4 |
| Provincial France | -1.4 | -0.1 | -0.9 | -3.0 | -2.9 | -3.3 |
| - Conurbation > 10 000 inhabitants | -1.3 | -0.1 | ** | -3.1 | -2.9 | ** |
| - Central town | -1.6 | 0.1 | ** | -3.2 | -2.9 | ** |
| - Suburb | -0.9 | -0.4 | ** | -3.1 | -2.9 | ** |
| - Conurbation < 10 000 inhabitants | -1.5 | 0.1 | ** | -2.1 | -2.5 | ** |
| Houses | ||||||
| Île-de-France | -1.6 | -0.4 | -0.3 | -2.9 | -2.1 | -1.9 |
| - Seine-et-Marne | -2.0 | -0.1 | -0.2 | -3.7 | -1.9 | -1.8 |
| - Yvelines | -1.4 | -0.7 | 0.4 | -2.9 | -1.7 | -1.2 |
| - Essonne | -1.7 | 0.2 | -0.5 | -3.5 | -1.6 | -1.9 |
| - Hauts-de-Seine | -1.0 | -2.7 | 0.7 | -0.8 | -2.7 | -1.4 |
| - Seine-Saint-Denis | -2.3 | 1.5 | -2.7 | -3.6 | -2.6 | -4.1 |
| - Val-de-Marne | -1.3 | -0.5 | -0.8 | -2.6 | -2.5 | -2.4 |
| - Val-d'Oise | -1.3 | -0.5 | -0.4 | -3.1 | -2.4 | -1.9 |
| Provincial France | -1.5 | 0.1 | -0.4 | -2.5 | -2.2 | -2.6 |
| Nord-Pas de Calais | -2.0 | 1.3 | ** | -4.3 | -2.6 | ** |
| - Flats | -2.0 | 0.3 | ** | -7.0 | -5.5 | ** |
| - Houses | -2.0 | 1.5 | ** | -3.8 | -2.0 | ** |
| - Lille Houses | -2.1 | 1.9 | ** | -3.1 | -1.1 | ** |
| Provence-Alpes-Côte d'Azur | -1.7 | -1.4 | ** | -3.9 | -4.2 | ** |
| - Flats | -1.2 | -0.8 | ** | -3.3 | -3.2 | ** |
| - Houses | -2.2 | -1.9 | ** | -4.5 | -5.2 | ** |
| - Marseille Flats | 0.5 | -3.2 | ** | -3.4 | -6.1 | ** |
| Rhône-Alpes | -0.8 | -0.2 | ** | -1.7 | -2.0 | ** |
| - Flats | -0.8 | 0.6 | ** | -1.9 | -1.5 | ** |
| - Houses | -0.7 | -1.0 | ** | -1.5 | -2.5 | ** |
| - Lyon Flats | -0.9 | 1.6 | ** | -1.4 | -0.3 | ** |
- ** index released on the 6th October 2015
- (p): provisional
- (sd): semi-definitive
- Sources: INSEE, French notaries - Database Bien, Perval society
Pour en savoir plus
