


 23 July 2014
2014- n° 170In July 2014, the business climate indicator goes back to the level of May in the
retail trade and in the trade and repair of motor vehicles Monthly survey of retailing - July 2014
23 July 2014
2014- n° 170In July 2014, the business climate indicator goes back to the level of May in the
retail trade and in the trade and repair of motor vehicles Monthly survey of retailing - July 2014
Warning : as each year in July, the seasonal components have been updated, as well as the parameters of the composite indicator, which leads to slight revisions.

Warning : as each year in July, the seasonal components have been updated, as well as the parameters of the composite indicator, which leads to slight revisions.
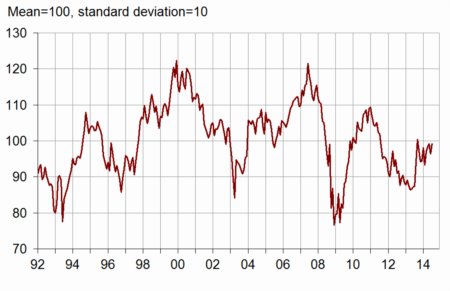
According to the managers surveyed in July 2014, the business climate synthetic indicator recovers and gets closer to its average in the retail trade and in the trade and repair of motor vehicles. Its has won three points and has come back to the level of May.
graphiquegraph_indsynt_en – Business climate synthetic indicator
Less pessimism about activity
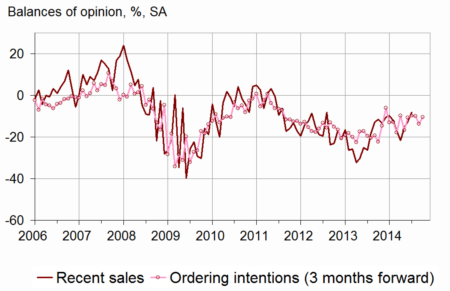
About their activity, business leaders have been less pessimistic than in June: less of them have declared a decrease in their recent and expected sales and in their ordering intentions. Each of the three balances has slightly progress and got closer to its average. However general business outlook have remained under their mean level fot three surveys in a row, showing that the managers remain pessimistic about the economic situation in the trade sector.
The past prices balance has been still very low, but the expected prices one has gone up.
The cash flow position has been declared slightly more difficult than in May.
graphiqueGraph_ventes_ic_en – Recent sales and ordering intentions
tableautab1_en – Global data
| Ave. (1) | April 14 | May 14 | June 14 | July 14 | |
|---|---|---|---|---|---|
| Business climate | 100 | 98 | 99 | 96 | 99 |
| General business outlook | –30 | –34 | –33 | –34 | –34 |
| Recent sales | –7 | –22 | –15 | –13 | –8 |
| Expected sales | –3 | –5 | –6 | –13 | –6 |
| Ordering intentions | –9 | –10 | –10 | –14 | –10 |
| Stocks | 11 | 4 | 7 | 7 | 6 |
| Past selling prices (2) | –6 | –17 | –16 | ||
| Expected selling prices | –3 | –16 | –15 | –15 | –10 |
| Cash position (2) | –15 | –18 | –20 | ||
| Workforce size: recent trend | 0 | –3 | –3 | –2 | –2 |
| Workforce size: future trend | –2 | –4 | –3 | –6 | –3 |
- (1) Average since 1991 (2004 for recent and expected sales and ordering intentions).
- (2) Bi-monthly question (odd-numbered months).
- Source: monthly survey in the retail trade and in the trade and repair of motor vehicles - INSEE
Less job losses
According to the business managers, workforce trend has remained stable over the last few months, but might slightly intensify over the next few months, in both retail trade and trade of motor vehicles.
Retail trade
Still very low estimated prices in non-specialized trade
In non-specialized trade, less retailers than in June have declared a fall in their past activity. The corresponding balance has progressed for three surveys in a row and got closer to its mean level. On the other hand, in specialized trade, past activity has declined, the balance staying below its average.
In the whole retail trade, the expected sales balance has gone up and the ordering intentions one has stabilized. Each of the two has remained below its average.
Stocks are still estimed moderately below their normal level.
In non-specialized trade, the balances concerning past and expected prices have remained very low, while they have recovered in specialized trade.
Trade and repair of motor vehicles
graphiquegraph_ventes_ic_auto_en – Recent sales and ordering intentions in motor vehicles
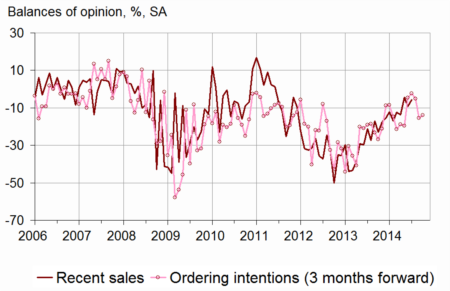
Slight improvement in past activity
In trade and repair of motor vehicles, managers have declared that their past activity has slightly improved, the corresponding balance has stayed above its average. Concerning expected sales and ordering intentions, the motor car traders have been more optimistic, each of both balances being close to its mean level yet.
The balances concerning prices has progressed, moderately for past prices, more sharply for expected prices.
tableautab2_en – Detailed data
| Ave. (1) | April 14 | May 14 | June 14 | July 14 | |
|---|---|---|---|---|---|
| Retail trade - Global data | |||||
| Recent sales | –5 | –25 | –20 | –14 | –9 |
| Expected sales | 0 | –6 | –5 | –12 | –6 |
| Ordering intentions | –7 | –9 | –10 | –14 | –13 |
| Stocks | 10 | 5 | 8 | 7 | 7 |
| Past selling prices (2) | –8 | –22 | –22 | ||
| Expected selling prices | –5 | –22 | –22 | –21 | –17 |
| Cash position (2) | –13 | –17 | –18 | ||
| Workforce size: recent trend | 1 | –1 | 1 | 0 | 0 |
| Workforce size: future trend | –2 | –3 | –1 | –4 | –1 |
| Non-specialized retail trade | |||||
| Recent sales | –1 | –33 | –22 | –15 | –2 |
| Expected sales | 6 | –2 | 3 | –9 | 0 |
| Ordering intentions | 1 | –2 | –2 | –6 | –5 |
| Stocks | 7 | 2 | 2 | 4 | 3 |
| Past selling prices (2) | –8 | –29 | –29 | ||
| Expected selling prices | –5 | –27 | –26 | –23 | –22 |
| Cash position (2) | –7 | –9 | –9 | ||
| Specialized retail trade | |||||
| Recent sales | –9 | –16 | –17 | –13 | –18 |
| Expected sales | –7 | –9 | –14 | –15 | –17 |
| Ordering intentions | –17 | –15 | –21 | –20 | –20 |
| Stocks | 14 | 9 | 14 | 11 | 11 |
| Past selling prices (2) | –8 | –16 | –11 | ||
| Expected selling prices | –4 | –16 | –16 | –18 | –11 |
| Cash position (2) | –22 | –26 | –27 | ||
| Trade and repair of motor cars and motorcycles | |||||
| Recent sales | –11 | –14 | –4 | –9 | –6 |
| Expected sales | –10 | –2 | –11 | –14 | –9 |
| Ordering intentions | –14 | –2 | –5 | –16 | –14 |
| Stocks | 15 | 3 | 5 | 6 | 4 |
| Past selling prices (2) | 1 | –4 | –3 | ||
| Expected selling prices | 4 | –3 | 2 | 0 | 7 |
| Cash position (2) | –26 | –19 | –22 | ||
| Workforce size: recent trend | –10 | –13 | –15 | –9 | –9 |
| Workforce size: future trend | –8 | –5 | –10 | –14 | –10 |
- (1) Average since 1991 (2003 for trade and repair of motor vehicles and 2004 for recent and expected sales and ordering intentions).
- (2) Bi-monthly question (odd-numbered months).
- Source: monthly survey in the retail trade and in the trade and repair of motor vehicles - INSEE
Documentation
Methodology (pdf,129 Ko)
Pour en savoir plus
