


 3 December 2015
2015- n° 298Increase in the unemployment rate in Q3 2015 ILO Unemployment and Labour Market-related indicators (Labour Force Survey results)
- 3rd Quarter 2015
3 December 2015
2015- n° 298Increase in the unemployment rate in Q3 2015 ILO Unemployment and Labour Market-related indicators (Labour Force Survey results)
- 3rd Quarter 2015
In Q3 2015, the average ILO unemployment rate in metropolitan France and overseas departments stood at 10.6% of active population. In metropolitan France only, the number of unemployed has risen by 75,000 to 2.9 million people unemployed ; thus, the unemployment rate increased by 0.2 percentage points q-o-q, standing at 10.2% of the active population. It increased across all age groups, but more particularly youth. Over a year, the unemployment rate increased by 0.2 percentage points.
The unemployment rate increased by 0.2 point over Q2 2015
In Q3 2015, the average ILO unemployment rate in metropolitan France and overseas departments stood at 10.6% of active population. In metropolitan France only, the number of unemployed has risen by 75,000 to 2.9 million people unemployed ; thus, the unemployment rate increased by 0.2 percentage points q-o-q, standing at 10.2% of the active population. It increased across all age groups, but more particularly youth. Over a year, the unemployment rate increased by 0.2 percentage points.
graphiquegraph_cho_nvIR – ILO-unemployment rate
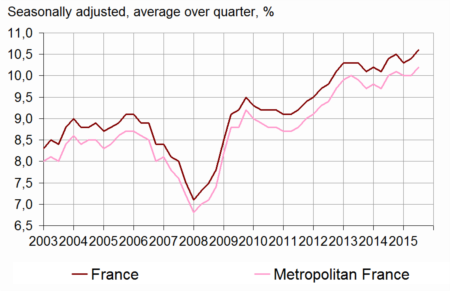
- Estimation close to +/-0.3 points of the level of unemployment rate and of its quarterly variations
- Covers the population of people living in households, people aged 15 years or more
- Source: INSEE, Labour Force Survey
Decline in the unemployment halo compared to previous quarter
In metropolitan France, among inactive people, 1.4 million wish to work but they are not considered as unemployed according to the ILO definition: they are part of the halo around unemployment. In Q3 2015, the number of people in this unemployment halo decreased sharply q-o-q (–64,000).
tableautab_cho_nvIR – Ilo-unemployment rate in metropolitan France
| ILO-unemployment rate (%) | Variation in point | Thousands | |||
|---|---|---|---|---|---|
| 2015Q2 | 2015Q3 (p)* | over quarter | over year | 2015Q2 (p)* | |
| Total | 10.0 | 10.2 | 0.2 | 0.2 | 2 941 |
| 15-24 years | 23.6 | 24.6 | 1.0 | 0.8 | 659 |
| 25-49 years | 9.3 | 9.5 | 0.2 | 0.1 | 1 694 |
| 50 years and more | 7.0 | 7.2 | 0.2 | 0.5 | 588 |
| Men | 10.5 | 10.8 | 0.3 | 0.6 | 1 606 |
| 15-24 years | 23.7 | 25.6 | 1.9 | 0.9 | 370 |
| 25-49 years | 9.7 | 9.7 | 0.0 | 0.3 | 899 |
| 50 years and more | 7.6 | 8.0 | 0.4 | 1.3 | 336 |
| Women | 9.4 | 9.7 | 0.3 | –0.1 | 1 335 |
| 15-24 years | 23.4 | 23.4 | 0.0 | 0.6 | 289 |
| 25-49 years | 8.9 | 9.3 | 0.4 | 0.0 | 795 |
| 50 years and more | 6.4 | 6.3 | –0.1 | –0.5 | 252 |
- *(p) = provisional results
- Covers the population of people living in households in metropolitan France, people aged 15 years or more
- Source: INSEE, Labour Force Survey
graphiquegraph_halo_IR – People in unemployment's halo
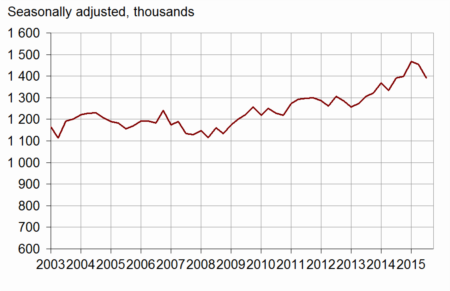
- Covers the population of people living in households in metropolitan France, people aged 15 years or more
- Source: INSEE, Labour Force Survey
The employment rate remained steady and the activity rate increased slightly
The employment rate of the population aged 15-64 years stood at 64.2% in Q3 2015, as in the previous quarter and in Q3 2015.
tableautab_partpop_nvIR – ILO employment, unemployment and activity in the population aged 15-64 years
| % of people in the age group | Variation in point over | Thous-ands (1) | |||
|---|---|---|---|---|---|
| 2015Q2 | 2015Q3 (p)* | quarter | year | 2015Q3 (p)* | |
| Employed people | 64.2 | 64.2 | 0.0 | 0.0 | 25 497 |
| Full-time equivalent employment rate | 59.4 | 59.5 | 0.1 | 0.2 | 23 598 |
| Men | 67.5 | 67.4 | –0.1 | –0.3 | 13 148 |
| Women | 61.1 | 61.2 | 0.1 | 0.4 | 12 348 |
| 15-24 years | 28.3 | 28.0 | –0.3 | –0.2 | 2 023 |
| 25-49 years | 79.9 | 79.9 | 0.0 | –0.3 | 16 149 |
| 50-64 years | 59.7 | 59.8 | 0.1 | 1.0 | 7 324 |
| Included : 55-64 years | 48.8 | 48.9 | 0.1 | 1.7 | 3 896 |
| Core employment rate of 55-64 years | 48.3 | 48.3 | 0.0 | 1.5 | |
| Unemployed persons | 7.2 | 7.4 | 0.2 | 0.2 | 2 935 |
| Men | 8.0 | 8.2 | 0.2 | 0.4 | 1 602 |
| Women | 6.4 | 6.6 | 0.2 | –0.1 | 1 332 |
| 15-24 years | 8.7 | 9.1 | 0.4 | 0.3 | 659 |
| 25-49 years | 8.2 | 8.4 | 0.2 | 0.1 | 1 694 |
| 50-64 years | 4.6 | 4.7 | 0.1 | 0.3 | 582 |
| Included : 55-64 years | 4.0 | 4.0 | 0.0 | 0.3 | 316 |
| Active people | 71.5 | 71.6 | 0.1 | 0.2 | 28 431 |
| Men | 75.5 | 75.6 | 0.1 | 0.2 | 14 750 |
| Women | 67.5 | 67.8 | 0.3 | 0.4 | 13 681 |
| 15-24 years | 37.0 | 37.1 | 0.1 | 0.0 | 2 683 |
| 25-49 years | 88.1 | 88.3 | 0.2 | –0.2 | 17 843 |
| 50-64 years | 64.3 | 64.5 | 0.2 | 1.3 | 7 906 |
| Included : 55-64 years | 52.8 | 52.9 | 0.1 | 2.0 | 4 211 |
| Active life expectancy of 55-64 years (years) | 5.2 | 5.2 | 0.0 | 0.1 | |
- *(p) = provisional results
- Covers the population of people living in households in metropolitan France, people aged 15 years or more
- (1) those data cover the people who are 15-64 years old. They are slightly different of the data in the previous table (which covers the total population).
- Source: INSEE, Labour Force Survey
Permanent contracts employment rate remained at 48.6% in Q3 2015. It decreased by 0.3 percentage points year-on-year. Temporary contracts employment rate stood at 7.4%. It increased by 0.1 percentage points q-o-q, and by 0.6 percentage points y-o-y.
The activity rate of people aged 15-64 stood at 71.6% in Q3 2015. It increased by 0.1 percentage points quarter-on-quarter and by 0.2 percentage points year-on-year.
Underemployment increased slightly again
In Q3 2015, 6.7% of the employed persons were underemployed, increasing by 0.1 percentage points over the quarter. It mainly concerns people who have a part-time job and wish to work more. Slack work stood at 0.3% of the employed.
tableauTab_ssemp_nvIR – ILO underemployment
| ILO underemployment rate (%) | Variation in point | Thousands | |||
|---|---|---|---|---|---|
| 2015Q2 | 2015Q3 (p)* | Over a quarter | Over a year | 2015Q3 (p)* | |
| Total | 6.6 | 6.7 | 0.1 | 0.3 | 1 720 |
| Included : slack work | 0.3 | 0.3 | 0.0 | –0.1 | 87 |
| Men | 3.6 | 3.8 | 0.2 | 0.2 | 505 |
| Women | 9.8 | 9.8 | 0.0 | 0.4 | 1 214 |
- *(p) = provisional results
- Covers the population of people living in households in metropolitan France, people aged 15 years or more
- Source: INSEE, Labour Force Survey
Revision
The ILO unemployment rate of Q2 2015 in metropolitan France remains unchanged, compared to the provisional result published in September 2015. It is revised upwards by 0.1 percentage points in France including overseas departments.
Pour en savoir plus
