


 27 November 2015
2015- n° 291In October 2015, household consumption of goods fell back (–0.7%) Household consumption expenditure on goods - October 2015
27 November 2015
2015- n° 291In October 2015, household consumption of goods fell back (–0.7%) Household consumption expenditure on goods - October 2015
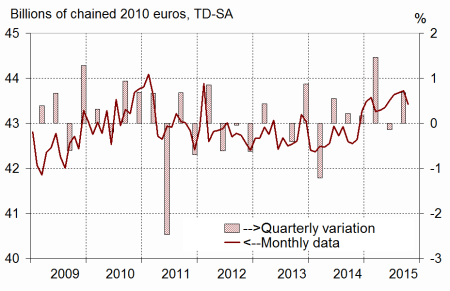
In October 2015, household consumption expenditure declined by 0.7% in volume* thus experiencing its first decrease since March 2015. This downturn is primarily due to the drop in purchases of durable goods (–1.8% after +1.6%).
In October 2015, household consumption expenditure declined by 0.7% in volume* thus experiencing its first decrease since March 2015. This downturn is primarily due to the drop in purchases of durable goods (–1.8% after +1.6%).
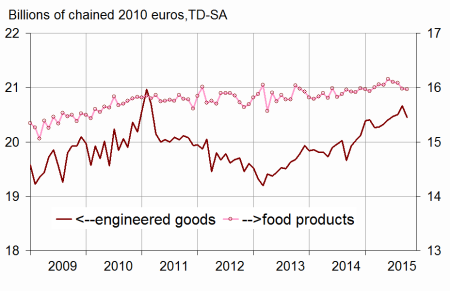
Engineered goods: dropping back
In October, consumption of engineered goods dwindled (–1.1% after +0.8% in September).
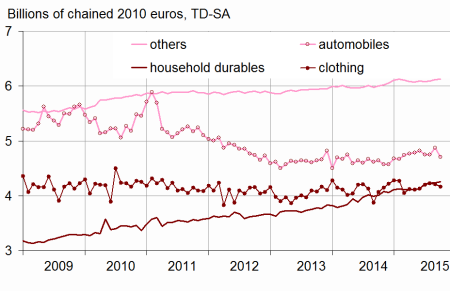
Durables: marked decline
In October, expenditure on durable goods fell back substantially (–1.8% after +1,6%). Car purchases declined sharply (–3.4% after +2.6%). Nevertheless, expenditure on household durables sped up slightly (+0.5% after +0.1%), driven up by the rebound in furnitures purchases.
Textile-clothing: dipping again
In October, expenditure on textile, clothing and leather decreased again (–1.0% after –0.4%).
Other engineered goods: slight growth
Expenditure on other engineered goods rose for the third consecutive month (+0.2% in October), but slowed. More specifically, drug and perfume purchases went up, whereas expenditure on hardware fell back.

[* Volumes are chained and all figures are trading days and seasonally adjusted.]
graphiquegraph1_new_ang – Total consumption of goods
- Source: INSEE
graphiquegraph2_new_ang – Food and engineered goods
- Source: INSEE
graphiquegraph3_new_ang – Breakdown of engineered goods
- Source: INSEE
Food products: stability
In October, food products consumption stabilized after decreasing for three months in a row.
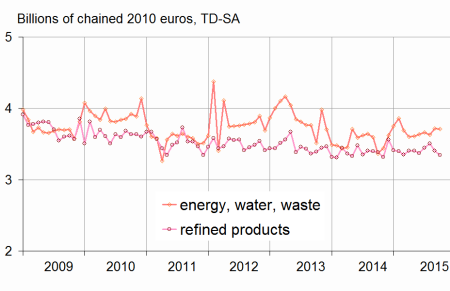
Energy: moderate dip
Energy consumption went down again in October (–1.1% after –0.1%): expenditure on refined products, dropped for the second consecutive month, in line with domestic oil consumption and despite a rebound in diesel fuel purchases. Expenditure on gas and electricity declined slightly.
The variation in September 2015 is scaled up
The variation of household expenditure on goods in September 2015 is scaled up slightly: +0.1% instead of 0.0%. Indeed, since the previous publication, new information has been integrated, in particular regarding household durables, and the seasonal adjustment coefficients have been updated.
graphiquegraph4_new_ang – Energy
- Source: INSEE
tableautab1_eng – Household consumption expenditure on goods
| Weight (1) | Aug. | Sept. | Oct. | Oct. 15 / Oct. 14 | T / T-1 (2) | |
|---|---|---|---|---|---|---|
| Food products | 38 | –0.1 | –0.7 | 0.0 | 0.3 | –0.6 |
| Engineered goods | 44 | 0.2 | 0.8 | –1.1 | 2.6 | 0.7 |
| - Inc. Durables | 21 | 0.0 | 1.6 | –1.8 | 3.0 | 0.5 |
| - Automobiles | 11 | 0.0 | 2.6 | –3.4 | 1.2 | –0.2 |
| - Household durables | 7 | 0.3 | 0.1 | 0.5 | 6.2 | 2.1 |
| - Inc. Textile-clothing | 10 | 0.6 | –0.4 | –1.0 | 2.5 | 1.3 |
| - Inc. Other engineered goods | 13 | 0.1 | 0.4 | 0.2 | 2.1 | 0.5 |
| Energy | 18 | 0.4 | –0.1 | –1.1 | 4.4 | 0.9 |
| - Inc. Energy, water, waste | 10 | –0.8 | 2.5 | –0.3 | 10.1 | 1.4 |
| - Inc. Refined Products | 9 | 1.8 | –2.9 | –2.0 | –1.3 | 0.4 |
| Total | 100 | 0.1 | 0.1 | –0.7 | 2.1 | 0.3 |
| - Inc. Manufactured goods | 85 | 0.3 | 0.0 | –0.7 | 1.6 | 0.4 |
- (1) Weighting in the consumption expenditure on goods in value
- (2) Last three months / previous three months
- Source: INSEE
Documentation
Methodology (pdf,23 Ko)
Pour en savoir plus
