


 30 September 2014
2014- n° 224Households consumption of goods in August was at its level of June (-0.7% in July
then +0.7% in August) Household consumption expenditure on goods - July-August 2014
30 September 2014
2014- n° 224Households consumption of goods in August was at its level of June (-0.7% in July
then +0.7% in August) Household consumption expenditure on goods - July-August 2014
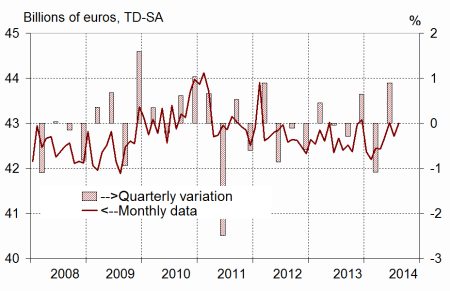
In August 2014, households expenditure on goods increased by 0.7% in volume*, after a 0.7% decrease in July. The decline of consumption of food products mainly contributed to the overall decrease in July. The raise in August was mainly attributable to a rebound in the consumption of food products, energy products and “other engineered goods”.
In August 2014, households expenditure on goods increased by 0.7% in volume*, after a 0.7% decrease in July. The decline of consumption of food products mainly contributed to the overall decrease in July. The raise in August was mainly attributable to a rebound in the consumption of food products, energy products and “other engineered goods”.
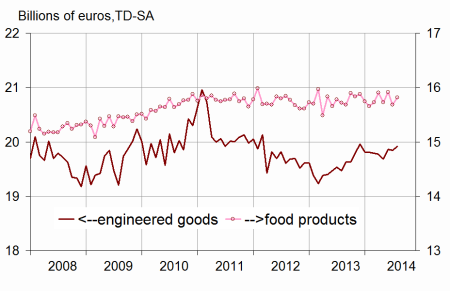
Engineered goods : slightly increasing
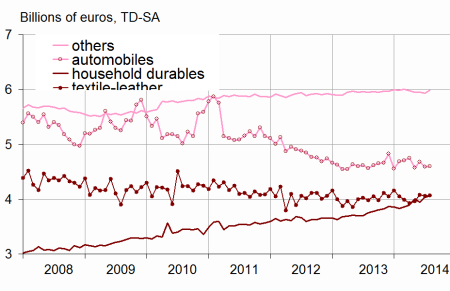
Durables: slightly increasing
After a clear rise in June (+0.6%), households expenditure on durable goods more slightly increased in July and August (+0.1%). The slowdown in July mainly arised from the downturn in car purchases (-1.8 % after +2.2 % in June), partially offset by the upturn in spending on housing equipment (+2.4 % after +1.5 %). In August, car consumption was almost stable (+0.1 %) while spending on housing equipment decelerated (+0.5 %).
Textile-leather: August at June level
After a rise in June (+2.9%), households consumption of textile and leather weakened in July (–0.3%), before bouncing in August (+0.3%) up to its June level.
Other engineered goods: increasing in August
Consumption expenditure on other engineered goods slightly decreased in July (–0.3% after a stability in June), before recovering in August (+0.9%), mainly due to hardware as well as perfumes consumption.
[* Volumes are chained and all figures are trading days and seasonally adjusted.]
graphiquegraph1_new_ang – Total consumption of goods
graphiquegraph2_new_ang – Food and engineered goods
graphiquegraph3_new_ang – Breakdown of engineered goods
Food products: decrease in July, bounce in August
In July, consumption of food products decreased (–1.5% after +1.2% in June) then bounced back in August (+0.8%).
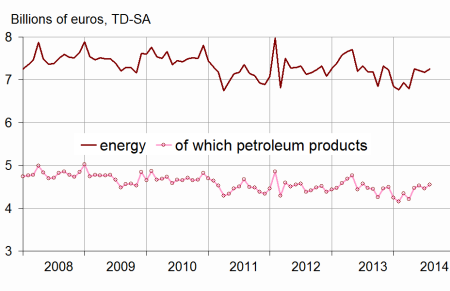
Energy: decrease in July, bounce in August
After a decrease in June (-0.4%), households consumption of energy products decreased anew in July (–0.6%), and then bounced back in August (+1.1%), an increase mainly due to a rebound in the expenditure on fuel. However, these variations has remained weak given the usual volatility of the consumption of energy.
The evolution in June is scaled down by 0.1 point
Household consumption of goods in June is scaled downward by -0.1 point (+0.8% against +0.9% within the previous publication).
This revision is mainly due to the integration of new information, as well as the updating of the seasonal adjustment coefficients.
graphiquegraph4_new_ang – Energy
tableautab1_eng – Household consumption expenditure on goods
| June | July | Aug. | Aug.2014/ | |
|---|---|---|---|---|
| 2014 | 2014 | 2014 | Aug.2013 | |
| Food products | 15.917 | 15.686 | 15.818 | |
| Change (%) | 1.2 | –1.5 | 0.8 | 0.7 |
| Engineered goods | 19.863 | 19.841 | 19.916 | |
| change (%) | 0.9 | –0.1 | 0.4 | 2.3 |
| Durables | 9.841 | 9.850 | 9.859 | |
| change (%) | 0.6 | 0.1 | 0.1 | 3.3 |
| -Of which automobiles | 4.674 | 4.591 | 4.597 | |
| Change (%) | 2.2 | –1.8 | 0.1 | 0.7 |
| -Of which household durables | 3.943 | 4.037 | 4.059 | |
| Change (%) | –1.5 | 2.4 | 0.5 | 8.2 |
| Textile-leather | 4.073 | 4.059 | 4.072 | |
| Change (%) | 2.9 | –0.3 | 0.3 | 2.4 |
| Other engineered goods | 5.949 | 5.933 | 5.986 | |
| Change (%) | 0.0 | –0.3 | 0.9 | 0.6 |
| Energy | 7.220 | 7.179 | 7.257 | |
| Change (%) | –0.4 | –0.6 | 1.1 | 1.0 |
| -including petroeum products | 4.532 | 4.461 | 4.553 | |
| Change (%) | 1.3 | –1.6 | 2.0 | 1.9 |
| Total | 43.013 | 42.712 | 43.003 | |
| Change (%) | 0.8 | –0.7 | 0.7 | 1.4 |
| Manufactured goods | 36.725 | 36.379 | 36.677 | |
| Change (%) | 1.3 | –0.9 | 0.8 | 1.4 |
Documentation
Methodology (pdf,23 Ko)
Pour en savoir plus
