


 30 September 2015
2015- n° 241In August 2015, overall agricultural producer prices decreased by 1.7% Indices of agricultural prices - août 2015
30 September 2015
2015- n° 241In August 2015, overall agricultural producer prices decreased by 1.7% Indices of agricultural prices - août 2015
In August 2015, overall agricultural prices dipped by 1,7% compared to July, and by 2,1% over one year
In August 2015, overall agricultural prices dipped by 1,7% compared to July, and by 2,1% over one year
Cereal prices fell in August (-10.0%) offsetting the increase in July (+11.0%). The return to more normal weather conditions in Europe and in the United States has cancelled the fears from markets of decline in yields before the harvests. In one year, the price was almost unchanged (-0.9%), at a low level, reflecting an ample supply.
graphiquecereal – Producer prices of cereals
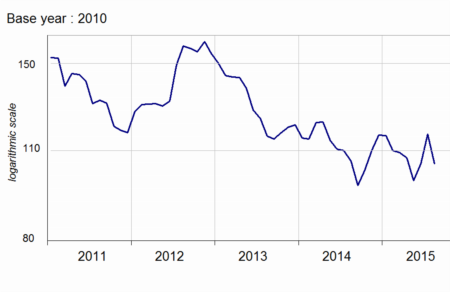
- Source : Insee
Oleaginous prices had declined since June, by almost 6%, due to the slowdown of Chinese economy and the fall of the oil price (as the biodiesel, made from rape, had turned less attractive against a less expensive oil).
Oleaginous prices slightly weakened in August (–0.8% over one month and –1.6% over one year). The 2014 harvest was good, except in the Languedoc-Roussillon region. Hence, the prices of common wines, massively produced in that place, rose significantly (+13.9% yoy). Conversely, prices of PDO (protected designation of origin) wines decreased sharply (–6.5% yoy).
Fresh fruits prices increased in August compared to last year at the same period (+14.7%). Peaches price jumped as a result of a limited supply and the heatwave, which had stimulated the consumption until mid-August. Pears became more expensive as well: it was a return to a more normal situation as the price of last year was noticeably low.
graphiquevegetable – Producer prices of fresh vegetables
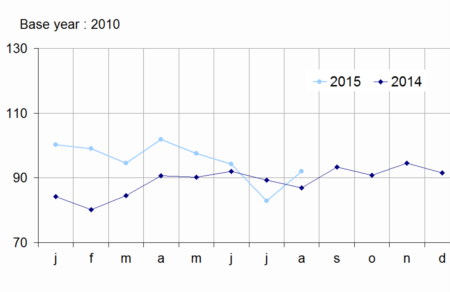
Fresh vegetable prices rose (+5.8% yoy). The summer-like weather prompted the consumers to favour summer vegetables, whose prices increased in August for most of them (tomato, cucumber). Conversely, melon price decreased as the supply was too abundant to sell easily, stemming from the strong rise in yields and significant importations.
graphiquepig – Producer prices of pigs and large cattle
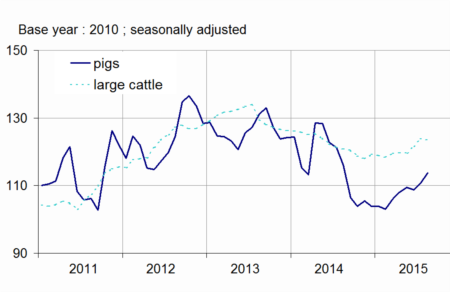
On a seasonally adjusted basis, animals prices went up in August (+0.6%). Pigs price rallied by 2.8% further to agreements with the slaughterers and the distributors under the auspices of the government, to revaluate the pigs. Milk prices went down sharply by 17.0% over one year: in 2014, the high prices and the strong Chinese demand had encouraged American and New Zealand farmers to boost their productions, however, since, the drop of Chinese importations and the Russian embargo had slowed down the global demand.
tableauTab1 – Indices of producer prices of agricultural products (IPPAP)
| weights | Aug. 2015 | Variation as % over | ||||
|---|---|---|---|---|---|---|
| a month | 3 months | a year | ||||
| raw | Seasonally adjusted | raw | ||||
| Agricultural goods output | 1000 | 112.5 | –1.7 | +0.1 | –2.1 | |
| excluding fruits and vegetables | 900 | 114.1 | –2.3 | +0.2 | –3.0 | |
| Crop output (excluding fruits and vegetables) | 505 | 114.1 | –4.2 | +1.0 | +0.1 | |
| Cereals | 188 | 105.1 | –10.0 | +6.2 | –0.9 | |
| of which soft wheat | 112 | 97.6 | –12.9 | +2.6 | –6.3 | |
| grain maize | 41 | 100.5 | –4.8 | +13.3 | +8.1 | |
| Potatoes | 26 | 109.9 | /// | /// | –4.5 | |
| Wines | 177 | 128.0 | –0.8 | –1.9 | –1.6 | |
| Protected designation of origin | 84 | 131.5 | –1.2 | –3.0 | –6.5 | |
| other wines | 23 | 148.0 | –0.8 | –2.2 | +13.9 | |
| Oleaginous | 49 | 100.6 | –3.8 | –2.3 | +16.7 | |
| Horticultural products | 30 | 106.6 | +0.5 | +0.7 | –0.5 | |
| Other crop products | 36 | 120.4 | 0.0 | +1.5 | +1.1 | |
| Fruits and vegetables (1) | 100 | 98.3 | /// | /// | +8.2 | |
| Fresh vegetables | 53 | 91.9 | /// | /// | +5.8 | |
| Fresh fruits | 35 | 103.3 | /// | /// | +14.7 | |
| Animal output | 395 | 114.0 | +0.2 | –0.8 | –6.6 | |
| Animals | 234 | 117.8 | +0.6 | +1.9 | –1.0 | |
| of which large cattle | 96 | 125.4 | –0.2 | +3.3 | +2.1 | |
| calves | 26 | 100.3 | –0.7 | –3.5 | –5.2 | |
| pigs | 54 | 120.8 | +2.8 | +4.0 | –1.9 | |
| sheep | 10 | 113.3 | +1.1 | –1.7 | –1.9 | |
| poultry | 46 | 110.6 | +0.5 | +0.1 | –3.9 | |
| of which chicken | 28 | 110.7 | +0.7 | +0.3 | –4.1 | |
| Milk | 147 | 106.7 | 0.0 | –7.5 | –17.0 | |
| of which cow milk (2) | 137 | 106.5 | 0.0 | –8.1 | –18.0 | |
| Eggs | 15 | 126.0 | –3.3 | +22.4 | +18.8 | |
- (1) Including vegetables for industry.
- (2)The price for Aug. is not yet known and therefore is estimated by carrying forward the seasonally adjusted price of July.
- Sources: Insee - SSP (ministry of agriculture)
The purchase prices of means of production decreased
In August, intermediate consumption prices had slipped for three months in a row (–1.8% since May) reflecting the drop of energy prices (–11.0% since May). Over one year, energy cost declined by almost 20%. Capital goods prices were virtually stable in August (+0.2%).
graphiquemeans – Purchase prices of the means of agricultural production

tableauTab2 – Indices of purchase prices of the means of agricultural production (IPAMPA)
| weights | Aug. 2015 | Variation as % over | |||
|---|---|---|---|---|---|
| a month | 3 months | a year | |||
| Total input | 1000 | 109,2 | –0.4 | –1.5 | –2.2 |
| Intermediate consumptions | 764 | 110,1 | –0.5 | –1.8 | –3.0 |
| Energy | 100 | 94,5 | –5.5 | –11.0 | –18.8 |
| Seeds | 57 | 108,8 | +0.3 | –0.1 | +0.4 |
| Fertilisers and soil improvers | 92 | 117,4 | 0.0 | –3.5 | +3.0 |
| Plant protection products | 78 | 100,8 | –0.1 | –0.4 | –0.5 |
| Animal feed | 205 | 117,9 | +0.2 | –0.2 | –3.5 |
| Veterinary expenses | 43 | 113,9 | +0.3 | +0.4 | +1.8 |
| Small equipment and tools | 17 | 109,6 | +0.2 | +1.5 | +0.3 |
| Maintenance of materials | 67 | 113,4 | +0.1 | +0.2 | +1.6 |
| Maintenance of buildings | 9 | 107,0 | +0.1 | +0.2 | –0.3 |
| Other goods and services | 97 | 101,5 | 0.0 | +0.1 | –0.4 |
| Goods and services contributing to investment | 236 | 106,7 | +0.2 | –0.4 | +0.3 |
| Material | 186 | 107,3 | +0.2 | –0.5 | +0.5 |
| Tractors | 79 | 106,7 | +0.2 | –1.0 | +0.2 |
| Machinery and plant for cultivation | 36 | 109,4 | +0.3 | +0.2 | +1.3 |
| Machinery and plant for harvesting | 42 | 107,8 | +0.3 | 0.0 | +0.6 |
| Utility vehicles | 18 | 104,8 | +0.2 | –0.2 | –0.4 |
| Buildings | 50 | 104,8 | –0.1 | 0.0 | –0.3 |
- (1) The repayment of the domestic tax on energy products (TICPE) benefiting farmers has been applied in advance for the year 2015
- Sources: Insee - SSP (ministry of agriculture)
Documentation
Methodology (pdf,122 Ko)
Pour en savoir plus
Time series : Indices of agricultural prices
