


 13 May 2015
2015- n° 117In April 2015, prices of frequently purchased goods were stable in hyper and supermarkets Price Index in large and predominantly-food stores - April 2015
13 May 2015
2015- n° 117In April 2015, prices of frequently purchased goods were stable in hyper and supermarkets Price Index in large and predominantly-food stores - April 2015
In April 2015, prices of frequently purchased goods remained broadly unchanged in all the kinds of stores.
In April 2015, prices of frequently purchased goods remained broadly unchanged in all the kinds of stores.
In hyper and supermarkets, this stability followed a slight decline in March (-0.1%).
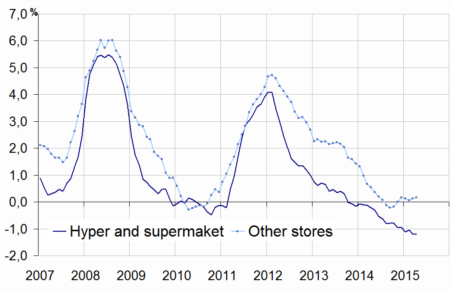
Year-on-year, prices of frequently purchased goods fell by 1.2% in hyper and supermarkets
Year-on-year, prices of frequently purchased goods decreased by 1.2% in hyper and supermarkets in April 2015, as in March. In April 2014, they had declined by 0.1% year-on-year.
In large and predominantly food stores, the prices of frequently purchased goods were down at roughly the same pace (-1.1% after -1.2% in March). In April 2014, they had diminished by 0.2% year-on-year.
Considering all of the stores, prices of frequently purchased goods fell less than in hyper and supermarkets (-0.8% as in March) due to a slight increase in other kinds of stores (+0.2% year-on-year). In April 2014, they had remained unchanged year-on-year.
graphiqueGraphique1English – Frequently purchased goods price indexes year-on-year change %
- Source : INSEE - Consumer Price Indexes
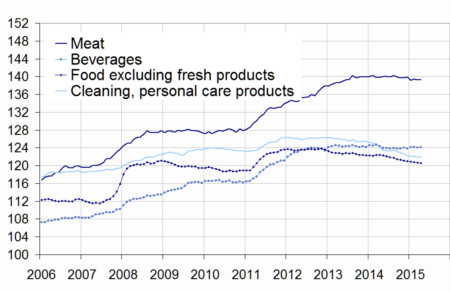
graphiqueGraphique2English – Frequently purchased goods price indexes
- Source : INSEE - Consumer Price Indexes
tableauTableau1English – Prices of frequently purchased goods
| Index | Changes (%) compared to | ||
|---|---|---|---|
| April 2015 | last month (m-o-m) | 12 months before (y-o-y) | |
| Hyper-and-Supermarkets (A) | 125.50 | 0.0 | -1.2 |
| Large and predominantly food stores (A + Neighbourhoodstores) | 126.59 | 0.0 | -1.1 |
| Other stores | 135.73 | 0.0 | 0.2 |
| All stores | 128.64 | 0.0 | -0.8 |
- Source: INSEE - Consumer Price Indexes
tableauTableau2English – Prices of frequently purchased goods detailed by main items
| Index | Changes (%) compared to | ||
|---|---|---|---|
| April 2015 | last month (m-o-m) | 12 months before (y-o-y) | |
| Food and beverages (excluding fresh foodstuffs) | 126.37 | 0.0 | -1.0 |
| - Meat | 139.25 | 0.0 | -0.4 |
| - Beverages | 124.18 | 0.1 | -0.3 |
| - Other food products | 120.58 | -0.1 | -1.6 |
| Clearing and personal care products | 121.94 | 0.0 | -2.0 |
| Total Hyper-and-Supermarkets | 125.50 | 0.0 | -1.2 |
- Source: INSEE - Consumer Price Indexes
Year-on-year, food prices continued to drop in hyper and supermarkets
In April 2015, prices of food excluding fresh foodstuffs were broadly unchanged in hyper and supermarkets (after a slight decrease by 0.1% in March). Year-on-year, the decline deepened during the last months (-1.0% in April after -0.9% in March and -0.8% in February). In April 2014, these prices had slightly risen year-on-year (+0.1%).
In particular, meat prices stabilized in hyper and supermarkets (after -0.1% in March). Year-on-year, they were down 0.4% (as in March). In April 2014, they had increased by 0.9% year-on-year.
Beverage prices rose slightly (+0.1% in April after -0.1% in March). Year-on-year, they decreased by 0.3% (after -0.5% in March). In April 2014, they had gone up somewhat year-on-year (+0.1%).
For the fifth consecutive month, prices of other food products (excluding unprocessed foodstuffs) went down by 0.1% in hyper and supermarkets. Year-on-year, they fell more markedly (-1.6% in April 2015 after -1.4% in March and -0.3% in April).
Prices of cleaning and personal care products were stable in April
In April 2015, prices of cleaning and personal care products were stable in hyper and supermarkets (after -0.1% in March). Year-on-year, they dropped by 2.0% (after -2.3% in March and -1.3% in April 2014).
Pour en savoir plus
