


 31 October 2014
2014- n° 252Household consumption of goods decreased in September (-0.8%), but increased over
the third quarter (+0.2%) Household consumption expenditure on goods - September 2014
31 October 2014
2014- n° 252Household consumption of goods decreased in September (-0.8%), but increased over
the third quarter (+0.2%) Household consumption expenditure on goods - September 2014
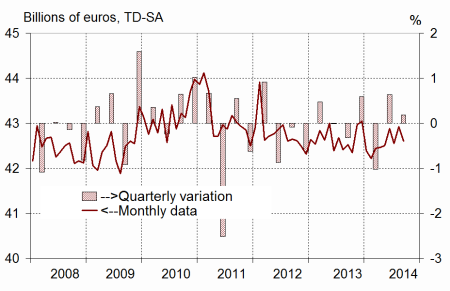
In September, household consumption expenditure on goods decreased: –0.8% in volume*, after +0.9% in August. This step back was mainly attributable to the marked drop in consumption of textile, clothing and leather (–7.2% in september). Yet it grew over the quarter (+0.2%) mainly as a result from a rise in consumption of energy products and durable goods.
- Engineered goods : declining in September, increasing slightly over the quarter
- Durables: increasing over the quarter
- Textile-leather: slumping in September, declining slightly over the quarter
- Other engineered goods: almost stable
- Food products: increasing in September, decreasing slightly over the quarter
- Energy: slipping in September, rising over the quarter
- The variation in August is scaled up by 0.2 points
In September, household consumption expenditure on goods decreased: –0.8% in volume*, after +0.9% in August. This step back was mainly attributable to the marked drop in consumption of textile, clothing and leather (–7.2% in september). Yet it grew over the quarter (+0.2%) mainly as a result from a rise in consumption of energy products and durable goods.
Engineered goods : declining in September, increasing slightly over the quarter
Durables: increasing over the quarter
Household expenditure on durable goods stepped back in September (–0.4%), after a growth in August (+0.6%). Expenditure on household durables dropped distinctly this past month (–3.1%), after two consecutive months of increase. Car purchases went up again (+0.9% after +0.3%), after a decrease in July (–1.7%).
Over the quarter, expenditure on durable goods decelerated (+0.4% after +1.0% in Q2). This change was mainly attributable to car purchases, which went down 0.9% in Q3. Conversely, expenditure on household durables picked up again in Q3 (+2.1% after +2.5% in Q2).
Textile-leather: slumping in September, declining slightly over the quarter
Consumption of textile, clothing and leather dropped markedly (–7.2% after +1.0%). It has been the largest decrease since May 2012. The downturn over Q3 was nonetheless less marked (–0.3%).
[* Volumes are chained and all figures are trading days and seasonally adjusted.]
graphiquegraph1_new_ang – Total consumption of goods
graphiquegraph2_new_ang – Food and engineered goods

graphiquegraph3_new_ang – Breakdown of engineered goods

Other engineered goods: almost stable
Consumption expenditure on other engineered goods edged down slightly in September (–0.3%, after +0.8%). It remained almost stable over the quarter (+0.1%).
Food products: increasing in September, decreasing slightly over the quarter
In September, consumption of food products increased again but slowed down (+0.4% after +0.9% in August). As a whole, it eased back in Q3 (–0.3%, after +0.9% in Q2).
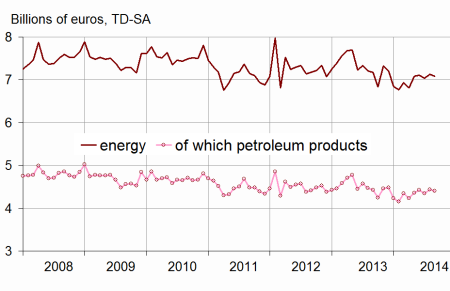
Energy: slipping in September, rising over the quarter
After recovering in August (+1.2%), household consumption of energy products dipped in September (–0.6%), the heat consumption falling notably because of above average temperatures.
Over the quarter, consumption of energy products decelerated (+1.2% after +2.2% in Q2).
The variation in August is scaled up by 0.2 points
Household consumption of goods is now estimated at +0.9% in August, instead of +0.7% estimated for the previous publication. Conversely, the estimation in May is scaled down by 0.5 points, at +0.1%.
This revision is mainly due to the updating of the seasonal adjustment coefficients, as well as the integration of new information on the indicators commonly used, mainly on household durables and car equipment.
graphiquegraph4_new_ang – Energy
tableauenglish_trim – Household consumption expenditure on goods
| July | Aug. | Sept. | Sept.2014/ | Q3 14/ | |
|---|---|---|---|---|---|
| 2014 | 2014 | 2014 | Sept.2013 | Q2 14 | |
| Food products | 15.691 | 15.826 | 15.888 | ||
| Change (%) | –1.4 | 0.9 | 0.4 | 1.4 | –0.3 |
| Engineered goods | 19.826 | 19.978 | 19.618 | ||
| Change (%) | –0.2 | 0.8 | –1.8 | –0.3 | 0.2 |
| Durables | 9.852 | 9.915 | 9.875 | ||
| Change (%) | 0.1 | 0.6 | –0.4 | 2.6 | 0.4 |
| - of which automobiles | 4.596 | 4.612 | 4.655 | ||
| Change (%) | –1.7 | 0.3 | 0.9 | 0.8 | –0.9 |
| - of which household durables | 4.032 | 4.097 | 3.972 | ||
| Change (%) | 2.2 | 1.6 | –3.1 | 5.0 | 2.1 |
| Textile-leather | 4.043 | 4.082 | 3.788 | ||
| Change (%) | –0.5 | 1.0 | –7.2 | –7.1 | –0.3 |
| Other engineered goods | 5.933 | 5.982 | 5.966 | ||
| Change (%) | –0.2 | 0.8 | –0.3 | 0.1 | 0.1 |
| Energy | 7.042 | 7.130 | 7.084 | ||
| Change (%) | –0.9 | 1.2 | –0.6 | –1.3 | 1.2 |
| - including petroleum products | 4.345 | 4.441 | 4.398 | ||
| Change (%) | –1.8 | 2.2 | –1.0 | –0.7 | 1.2 |
| Total | 42.552 | 42.929 | 42.600 | ||
| Change (%) | –0.8 | 0.9 | –0.8 | 0.2 | 0.2 |
| Manufactured goods | 36.374 | 36.752 | 36.493 | ||
| Change (%) | –0.9 | 1.0 | –0.7 | 0.7 | 0.1 |
Documentation
Methodology (pdf,23 Ko)
Pour en savoir plus
