


 23 January 2015
2015- n° 15In January 2015, the business climate improved again in the retail trade and in the
trade and repair of motor vehicles Monthly survey of retailing - January 2015
23 January 2015
2015- n° 15In January 2015, the business climate improved again in the retail trade and in the
trade and repair of motor vehicles Monthly survey of retailing - January 2015
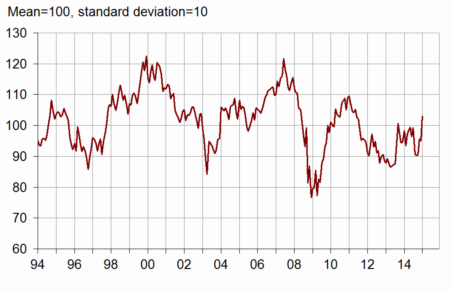
According to the managers surveyed in January 2015, the business climate has improved again in the retail trade and in the trade and repair of motor vehicles. The corresponding synthetic indicator has won eight points, going over its long-term average and reaching its mid-2011 level.
According to the managers surveyed in January 2015, the business climate has improved again in the retail trade and in the trade and repair of motor vehicles. The corresponding synthetic indicator has won eight points, going over its long-term average and reaching its mid-2011 level.
graphiquegraph_indsynt_en – Business climate synthetic indicator
Less pessimism on activity
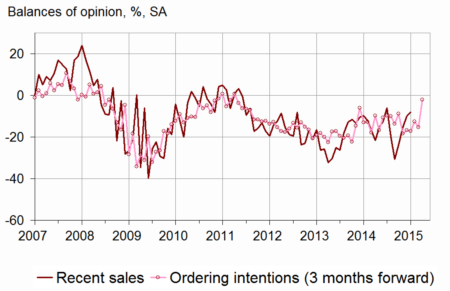
For four straight months, fewer business leaders have declared a fall in their past sales. The corresponding balance of opinion has returned to its average. Past activity of the motor car trade sector is especially well oriented.
Fewer managers have expected a decrease in their activity: each of the three balances concerning expected sales, ordering intentions and general outlook has reached or gone over its average.
Stocks have been estimed lower, coming back to their standard level.
The balances concerning prices have progressed but remained still low.
The cash-flow situation is estimed rather difficult.
graphiqueGraph_ventes_ic_en – Recent sales and ordering intentions
tableautab1_en – Global data
| Ave. (1) | Oct. 14 | Nov. 14 | Dec. 14 | Jan. 15 | |
|---|---|---|---|---|---|
| Business climate | 100 | 90 | 96 | 95 | 103 |
| General business outlook | –30 | –41 | –37 | –38 | –31 |
| Recent sales | –8 | –24 | –15 | –10 | –8 |
| Expected sales | –3 | –12 | –9 | –7 | –3 |
| Ordering intentions | –9 | –17 | –12 | –15 | –2 |
| Stocks | 11 | 8 | 11 | 19 | 10 |
| Past selling prices (2) | –6 | –24 | –17 | ||
| Expected selling prices | –3 | –15 | –12 | –10 | –8 |
| Cash position (2) | –15 | –22 | –19 | ||
| Workforce size: recent trend | 0 | –4 | –7 | –4 | –3 |
| Workforce size: future trend | –3 | –13 | –9 | –6 | –8 |
- (1) Average since 1991 (2004 for recent and expected sales and ordering intentions).
- (2) Bi-monthly question (odd-numbered months).
- Source: monthly survey in the retail trade and in the trade and repair of motor vehicles - INSEE
Still unfavourable employment situation
According to the business leaders, employment has remained deteriorated, over the last and over the next few months.
Retail trade
Expected upturn of activity
According to non-specialised retailers considered that recent sales have declined in this sector, the corresponding balance getting back to its average. Almost as many specialised retailers than in December have indicated a drop in their past activity, the balance remaining very low.
About their forecasts, retailers have been overall less pessimistic: each of the balances concerning expected sales and particularly ordering intentions have increased.
Stocks have got lower, going under their normal level, particularly in non-specialised trade.
Less managers than on the last survey have indicated falls in past prices and as many have expected further falls in the future.
The cash-flow situation is still declared difficult.
Trade and repair of motor vehicles
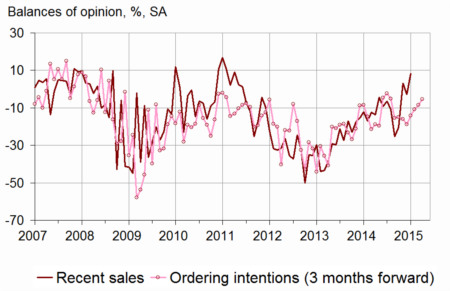
graphiquegraph_ventes_ic_auto_en – Recent sales and ordering intentions in motor vehicles
Rebuned in past and expected activities
According to managers in the trade and repair of motor vehicles, past sales have picked up again.
That rise might go on, considering expected sales and ordering: each of both corresponding balances has slightly increased, still over its mean level.
The level of stocks is considered slightly over its standard level.
Less vehicles leaders than on the last survey have declared drops in prices on the last few months. More of them expect drops on the next months.
tableautab2_en – Detailed data
| Ave. (1) | Oct. 14 | Nov. 14 | Dec. 14 | Jan. 15 | |
|---|---|---|---|---|---|
| Retail trade - Global data | |||||
| Recent sales | –6 | –25 | –22 | –13 | –15 |
| Expected sales | –1 | –12 | –13 | –9 | –6 |
| Ordering intentions | –7 | –18 | –13 | –19 | –5 |
| Stocks | 10 | 8 | 11 | 20 | 7 |
| Past selling prices (2) | –8 | –31 | –25 | ||
| Expected selling prices | –5 | –19 | –18 | –15 | –14 |
| Cash position (2) | –13 | –21 | –19 | ||
| Workforce size: recent trend | 1 | –3 | –5 | –2 | –1 |
| Workforce size: future trend | –2 | –12 | –10 | –6 | –9 |
| Non-specialized retail trade | |||||
| Recent sales | –2 | –26 | –14 | 5 | –2 |
| Expected sales | 5 | 0 | –4 | 8 | –10 |
| Ordering intentions | 1 | –9 | –3 | –17 | –1 |
| Stocks | 7 | 4 | 6 | 23 | 1 |
| Past selling prices (2) | –8 | –38 | –24 | ||
| Expected selling prices | –5 | –23 | –16 | –10 | –7 |
| Cash position (2) | –7 | –15 | –11 | ||
| Specialized retail trade | |||||
| Recent sales | –10 | –24 | –33 | –34 | –30 |
| Expected sales | –8 | –21 | –15 | –21 | –16 |
| Ordering intentions | –17 | –24 | –19 | –22 | –24 |
| Stocks | 14 | 13 | 16 | 17 | 15 |
| Past selling prices (2) | –8 | –24 | –24 | ||
| Expected selling prices | –5 | –13 | –20 | –22 | –22 |
| Cash position (2) | –22 | –27 | –28 | ||
| Trade and repair of motor cars and motorcycles | |||||
| Recent sales | –11 | –20 | 3 | –3 | 8 |
| Expected sales | –9 | –10 | –1 | –3 | 1 |
| Ordering intentions | –14 | –14 | –11 | –9 | –5 |
| Stocks | 15 | 8 | 13 | 15 | 18 |
| Past selling prices (2) | 1 | –7 | 3 | ||
| Expected selling prices | 4 | –2 | 3 | –1 | –6 |
| Cash position (2) | –26 | –23 | –23 | ||
| Workforce size: recent trend | –10 | –7 | –12 | –14 | –15 |
| Workforce size: future trend | –8 | –11 | –9 | –10 | –7 |
- (1) Average since 1991 (2003 for trade and repair of motor vehicles and 2004 for recent and expected sales and ordering intentions).
- (2) Bi-monthly question (odd-numbered months).
- Source: monthly survey in the retail trade and in the trade and repair of motor vehicles - INSEE
Documentation
Methodology (pdf,129 Ko)
Pour en savoir plus
