


 23 October 2014
2014- n° 243In October 2014, the business climate remains almost stable in services Monthly survey of services - October 2014
23 October 2014
2014- n° 243In October 2014, the business climate remains almost stable in services Monthly survey of services - October 2014
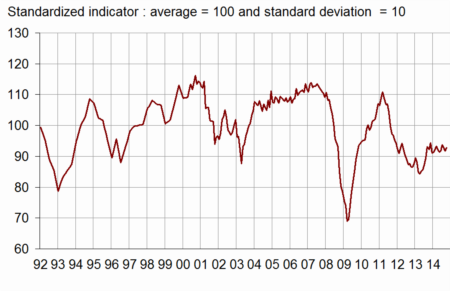
According to business managers, the economic situation in services is almost stable in October 2014. The business climate composite indicator increases by one point and stands at 93. The turning point indicator indicates a neutral zone.
All services
According to business managers, the economic situation in services is almost stable in October 2014. The business climate composite indicator increases by one point and stands at 93. The turning point indicator indicates a neutral zone.
The balance on the general outlook, which relates the assessment of business leaders over their whole sector, remains below its long-term average.
Business managers report that their activity has remained deteriorated over the last few months. Their business expectations for the coming months are less pessimistic than in September, although the corresponding balance remains below its long term average.
The balance of opinion on the past operating balance result has sharply recovered since July and stands above its long term average. However, there are more pessimistic business managers than in July about the expected result.
In services sector except temporary employment agencies, the balances of opinion on past and expected employment are steady and remain below their long-term averages.
graphiqueGraph1 – Composite indicator
graphiquegraph_retourn – Turning point indicator
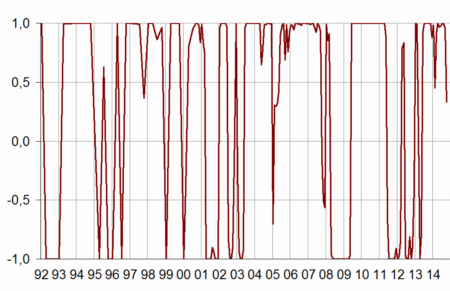
- Note: close to 1 (respectively -1), this indicator indicates a favorable short-term economic situation (respectively unfavorable).
tableauTable_quarter – Economic outlook in the services sector
| Average* | July 14 | Aug. 14 | Sept. 14 | Oct. 14 | |
|---|---|---|---|---|---|
| Composite indicator | 100 | 94 | 93 | 92 | 93 |
| General outlook | –8 | –16 | –18 | –17 | –20 |
| Past activity | 2 | –7 | –8 | –4 | –5 |
| Expected activity | 2 | –3 | –3 | –9 | –6 |
| Expected demand | –1 | –7 | –8 | –7 | –8 |
| Business situation | –3 | –13 | –10 | –12 | –9 |
| Past selling prices | –3 | –8 | –9 | –10 | –9 |
| Expected selling prices | –2 | –10 | –9 | –10 | –9 |
| Past employment | 3 | 1 | 1 | –1 | 4 |
| except temporary work agencies | 1 | –1 | –3 | 0 | 0 |
| Expected employment | 2 | –3 | –2 | 0 | 0 |
| except temporary work agencies | –1 | –6 | –4 | –3 | –4 |
| Investments | |||||
| Past investments | 1 | –1 | 0 | 3 | –1 |
| Expected investments | 1 | 1 | 1 | –1 | –2 |
| Operating balance result | |||||
| Past result | –2 | –17 | 0 | ||
| Expected result | –2 | –3 | –9 | ||
| Cash position | –11 | –15 | –15 | ||
| Difficulties of supply and demand | |||||
| difficulties of supply and demand | 10 | 12 | 13 | ||
| difficulties of supply only | 22 | 20 | 18 | ||
| difficulties of demand only | 31 | 40 | 39 | ||
| Difficulties in recruitment | 28 | 16 | 18 |
- * Average of the balances of opinion since 1988
- Source: Insee
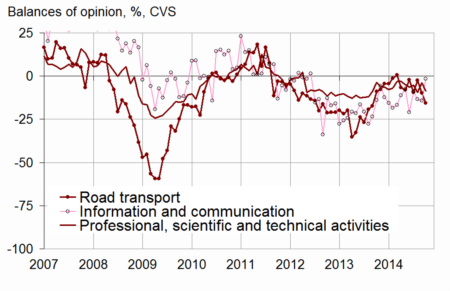
Road transport
In road freight and mail activities, business managers’ judgment on past and expected activity has deteriorated. The balance of opinion on expected demand is slighty improving and stands above its long-term average.
Accommodation and food service activities
In accommodation and food service activities, business managers consider that activity has declined over the last few months but the corresponding balance remains above its long term average. They expect a decline in activity for the coming months.
Information and communication
In information and communication, the balances of opinion on past activity, expected activity and expected demand have recovered in the recent months, but they remain significantly below their long term averages.
Real estate activities
In real estate activities, the balance on past activity has decreased. Despite a rise in expected activity, business managers’ expectations on demand remain deteriorated.
Professional, scientific and technical activities
In professional, scientific and technical activities, business managers indicate that their activity has fallen over the last few months. However, their expectations of activity and demand for the coming months are less pessimistic than in September.
Administrative and support service activities
In administrative and support service activities, the balances of opinion on past activity, expected activity and expected demand are still below their long term averages, and drop slightly.
graphiquegraph_bonus_ – Past activity
tableauTable_det – Detailed data
| A21 | Average* | July 14 | Aug. 14 | Sept. 14 | Oct. 14 |
|---|---|---|---|---|---|
| (H) Road transport | |||||
| Past activity | –8 | –10 | –2 | –10 | –16 |
| Expected activity | –10 | –6 | –16 | –8 | –9 |
| Expected demand | –13 | –6 | –20 | –13 | –10 |
| Past employment | –8 | –11 | –11 | –8 | –16 |
| Expected employment | –11 | –7 | –8 | –1 | –9 |
| (I) Accommodation and food service activities | |||||
| Past activity | –7 | –18 | 0 | 12 | 0 |
| Expected activity | –7 | –6 | 1 | –19 | –18 |
| Expected demand | –9 | –6 | –9 | –12 | –15 |
| Past employment | –4 | 4 | –3 | 13 | 8 |
| Expected employment | –5 | –10 | –2 | –6 | –13 |
| (J) Information and communication | |||||
| Past activity | 9 | –9 | –13 | –14 | –1 |
| Expected activity | 11 | –2 | –2 | –12 | –9 |
| Expected demand | 11 | –2 | –4 | –11 | –6 |
| Past employment | 6 | –2 | –6 | –12 | –10 |
| Expected employment | 11 | –13 | –7 | 1 | 4 |
| (L) Real estate activities | |||||
| Past activity | 7 | 6 | 4 | 1 | –2 |
| Expected activity | 7 | 0 | 2 | 3 | 6 |
| Expected demand | 1 | –3 | –2 | –5 | –5 |
| Past employment | 3 | 2 | 0 | –6 | 8 |
| Expected employment | 2 | 6 | 11 | 10 | 5 |
| (M) Professional, scientific and technical activities | |||||
| Past activity | –1 | –5 | –9 | –4 | –8 |
| Expected activity | –2 | –6 | –10 | –14 | –7 |
| Expected demand | –5 | –14 | –14 | –13 | –9 |
| Past employment | 1 | 0 | –2 | –3 | 0 |
| Expected employment | 0 | –1 | –7 | –5 | –2 |
| (N) Administrative and support service activities | |||||
| Past activity | 6 | –4 | –4 | –2 | –4 |
| Expected activity | 5 | 3 | 6 | 2 | –2 |
| Expected demand | 3 | –2 | –3 | –2 | –5 |
| Past employment | 8 | 6 | 8 | –1 | 11 |
| Expected employment | 6 | 7 | 1 | 3 | 6 |
- * Average of the balances of opinion since 1988 (2006 for road transport)
Documentation
Methodology (2016) (pdf,158 Ko)
Pour en savoir plus
Time series : Economic outlook surveys – Services
