


 4 September 2014
2014- n° 203Unemployment rate was almost steady in Q2 2014 ILO Unemployment and Labour Market-related indicators (Labour Force Survey results)
- 2nd quarter 2014
4 September 2014
2014- n° 203Unemployment rate was almost steady in Q2 2014 ILO Unemployment and Labour Market-related indicators (Labour Force Survey results)
- 2nd quarter 2014
In Q2 2014, the average ILO unemployment rate in metropolitan France and overseas departments stood at 10.2% after 10.1% in Q1 2014. In metropolitan France only, with 2.8 million people, 9.7% of the active population was unemployed. The unemployment rate was steady q-o-q. Over a year, it decreased by 0.2 percentage points in metropolitan France and by 0.1 percentage points in France and overseas departments.
Unemployment rate
The unemployment rate was almost steady in Q2 2014
In Q2 2014, the average ILO unemployment rate in metropolitan France and overseas departments stood at 10.2% after 10.1% in Q1 2014. In metropolitan France only, with 2.8 million people, 9.7% of the active population was unemployed. The unemployment rate was steady q-o-q. Over a year, it decreased by 0.2 percentage points in metropolitan France and by 0.1 percentage points in France and overseas departments.
graphiquegraph_cho_nvIR – ILO-unemployment rate
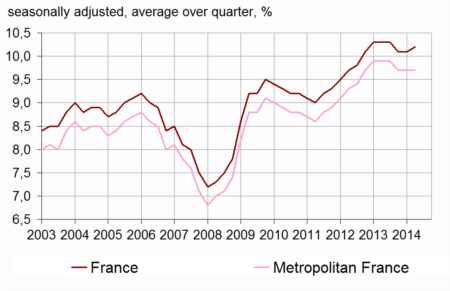
- Estimation close to +/-0.3 point of the of the level of unemployment rate and of its quarterly variations
- Covers the population of people living in households, people aged 15 years or more
- Source: INSEE, Labour Force Survey
Among inactive people, 1.3 million wish to work but they are not considered as unemployed: they are part of the unemployment’s halo. The number of people in the unemployment’s halo decreased by 40,000 in Q2 2014, and rose by 60,000 over the year.
tableautab_cho_nvIR – Ilo-unemployment rate in metropolitan France
| ILO-unemployment rate (%) | Variation in point | Thousands | |||
|---|---|---|---|---|---|
| 2014Q1 | 2014Q2 (p)* | over quarter | over year | 2014Q2 (p)* | |
| Total | 9,7 | 9,7 | 0,0 | –0,2 | 2 784 |
| 15-24 years | 22,8 | 22,8 | 0,0 | –1,6 | 613 |
| 25-49 years | 9,1 | 9,2 | 0,1 | 0,0 | 1 651 |
| 50 years and more | 6,7 | 6,6 | –0,1 | 0,0 | 520 |
| Men | 10,0 | 10,0 | 0,0 | –0,1 | 1 478 |
| 15-24 years | 23,0 | 24,0 | 1,0 | 0,1 | 353 |
| 25-49 years | 9,4 | 9,2 | –0,2 | –0,1 | 856 |
| 50 years and more | 6,7 | 6,7 | 0,0 | –0,1 | 270 |
| Women | 9,4 | 9,5 | 0,1 | –0,3 | 1 305 |
| 15-24 years | 22,5 | 21,5 | –1,0 | –3,5 | 260 |
| 25-49 years | 8,7 | 9,2 | 0,5 | 0,1 | 794 |
| 50 years and more | 6,7 | 6,4 | –0,3 | 0,1 | 250 |
- *(p) = provisional results
- Covers the population of people living in households in metropolitan France, people aged 15 years or more
- Source: INSEE, Labour Force Survey
graphiquegraph_halo_IR – People in unemployment's halo
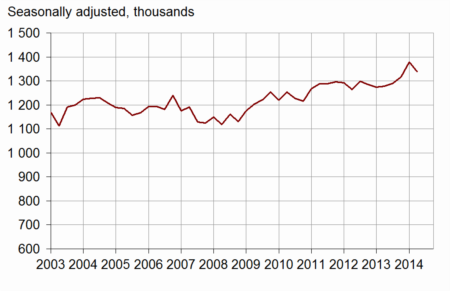
- Covers the population of people living in households in metropolitan France, people aged 15 years or more
- Source: INSEE, Labour Force Survey
ILO employment and activity
tableautab_partpop_nvIR – ILO employment, unemployment and activity in the population aged 15-64 years
| % of people in the age group | Variation in point over | Thousands (1) | |||
|---|---|---|---|---|---|
| 2014Q1 | 2014Q2 (p)* | quarter | year | 2014Q2 (p)* | |
| Employed people | 64,2 | 64,2 | 0,0 | 0,2 | 25 532 |
| Full-time equivalent employment rate | 59,6 | 59,5 | –0,1 | –0,1 | 23 667 |
| Men | 67,6 | 67,6 | 0,0 | –0,3 | 13 210 |
| Women | 60,9 | 60,9 | 0,0 | 0,6 | 12 322 |
| 15-24 years | 28,5 | 28,3 | –0,2 | –0,1 | 2 071 |
| 25-49 years | 80,7 | 80,5 | –0,2 | –0,3 | 16 315 |
| 50-64 years | 58,2 | 58,6 | 0,4 | 1,1 | 7 146 |
| Included : 55-64 years | 46,3 | 46,9 | 0,6 | 1,4 | 3 729 |
| Core employment rate of 55-64 years | 46,0 | 46,6 | 0,6 | 1,2 | |
| Unemployed persons | 7,0 | 7,0 | 0,0 | –0,1 | 2 778 |
| Men | 7,6 | 7,5 | –0,1 | –0,2 | 1 474 |
| Women | 6,3 | 6,4 | 0,1 | –0,2 | 1 303 |
| 15-24 years | 8,4 | 8,4 | 0,0 | –0,7 | 613 |
| 25-49 years | 8,0 | 8,1 | 0,1 | –0,1 | 1 651 |
| 50-64 years | 4,3 | 4,2 | –0,1 | 0,1 | 514 |
| Included : 55-64 years | 3,7 | 3,6 | –0,1 | 0,3 | 289 |
| Active people | 71,2 | 71,2 | 0,0 | 0,1 | 28 309 |
| Men | 75,2 | 75,1 | –0,1 | –0,5 | 14 684 |
| Women | 67,3 | 67,4 | 0,1 | 0,5 | 13 625 |
| 15-24 years | 36,9 | 36,7 | –0,2 | –0,8 | 2 684 |
| 25-49 years | 88,7 | 88,6 | –0,1 | –0,3 | 17 966 |
| 50-64 years | 62,5 | 62,8 | 0,3 | 1,2 | 7 660 |
| Included : 55-64 years | 50,0 | 50,6 | 0,6 | 1,8 | 4 018 |
| Active life expectancy of 55-64 years (years) | 5,0 | 5,0 | 0,0 | 0,1 | |
- *(p) = provisional results
- Covers the population of people living in households in metropolitan France, people aged 15 years or more
- (1) those data cover the people who are 15-64 years old. They are a little bit different of the data in the previous table (which covers the total population).
- Source: INSEE, Labour Force Survey
The employment rate of the population aged 15-64 years was steady in Q2 2014 and stood at 64.2%; over a year, it increased by 0.2 percentage points.
The activity rate of people aged 15-64 was also steady in Q2 2014 and stood at 71.2% (+0.1 percentage points y-o-y).
Underemployment concerns 6.2% of employed people
In Q2 2014, 6.2% of the persons employed were underemployed, decreasing by 0.1 percentage points.
Slack work stood at 0.3%. The unwanted part-time decreased by 0.2 percentage points and stood at 5.9% of the employed.
tableauTab_ssemp_nvIR – ILO underemployment
| ILO underemployment rate (%) | Variation in point | Thousands | |||
|---|---|---|---|---|---|
| 2014Q1 | 2014Q2 (p)* | Over a quarter | Over a year | 2014Q2 (p)* | |
| Total | 6,3 | 6,2 | –0,1 | –0,2 | 1 605 |
| Included : slack work | 0,2 | 0,3 | 0,1 | –0,2 | 68 |
| Men | 3,0 | 3,4 | 0,4 | 0,0 | 448 |
| Women | 9,6 | 9,4 | –0,2 | –0,3 | 1 157 |
- *(p) = provisional results
- Covers the population of people living in households in metropolitan France, people aged 15 years or more
- Source : INSEE, Labour Force Survey
Revision
The ILO unemployment rate of Q1 2014 is not revised compared to the temporary publication of June 2014.
Pour en savoir plus
