


 31 July 2014
2014- n° 180Household consumption on goods increased in June (+0.9%), as over the second quarter
(+1.0%) Household consumption expenditure on goods - June 2014
31 July 2014
2014- n° 180Household consumption on goods increased in June (+0.9%), as over the second quarter
(+1.0%) Household consumption expenditure on goods - June 2014
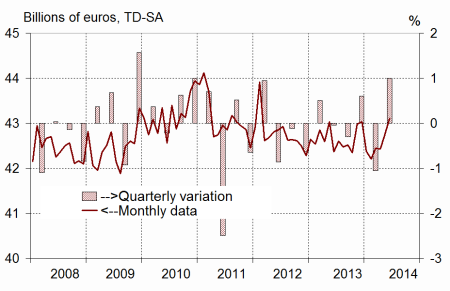
In June, household consumption expenditure on goods continued to accelerate: +0.9% in volume*, after +0.7% in May. It rose over the quarter as well (+1.0%). This quarterly increase resulted mainly from a jump in consumption of energy products which occurred in May and in purchases of household durables.
- Engineered goods : rebound in June, almost stable over the quarter
- Durables: increasing over the quarter
- Textile-leather: marked growth in June, but decline over the quarter
- Other engineered goods: almost stable
- Food products: rising in June as over the quarter
- Energy: almost stable in June, increasing over the quarter
- The evolution in May is scaled down by 0.3 points
In June, household consumption expenditure on goods continued to accelerate: +0.9% in volume*, after +0.7% in May. It rose over the quarter as well (+1.0%). This quarterly increase resulted mainly from a jump in consumption of energy products which occurred in May and in purchases of household durables.
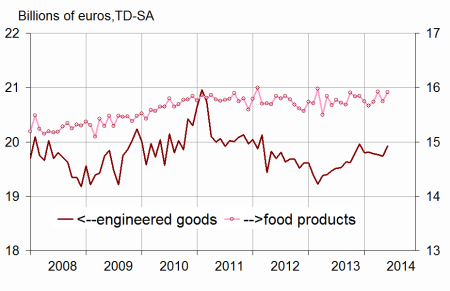
Engineered goods : rebound in June, almost stable over the quarter
Durables: increasing over the quarter
Household expenditure on durable goods went up in June (+0.5%), after a downturn in May (–0.9%). Expenditure on household durables stepped back (–1.5%), especially on electronic consumer goods after a sharp increase in May. Car purchases picked up markedly (+2.1% after –3.5%).
Over the quarter, expenditure on durable goods rose by 1.0%. This growth was mainly attributable to expenditure on household durables, which accelerated in Q2 (+2.5% after +0.5% in Q1 2014). Car purchases increased slightly (+0.4%).
Textile-leather: marked growth in June, but decline over the quarter
In June, consumption of textile, clothing and leather climbed for the second month in a row (+3.0% after +0.9% in May). However, it dipped over Q2 (–2.0%) after a slight rise in Q1 (+0.6%).
[* Volumes are chained and all figures are trading days and seasonally adjusted.]
graphiquegraph1_new_ang – Total consumption of goods
graphiquegraph2_new_ang – Food and engineered goods
graphiquegraph3_new_ang – Breakdown of engineered goods
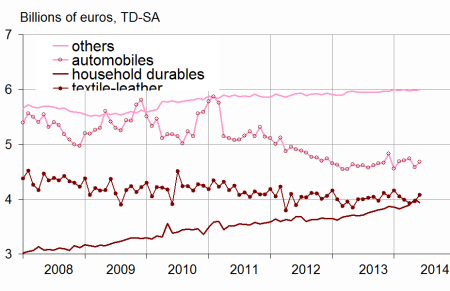
Other engineered goods: almost stable
Consumption expenditure on other engineered goods decelerated in June (+0.1%, after +0.2% in May), and declined slightly over the quarter (–0.1%), affected mostly by weaker purchases on hardware.
Food products: rising in June as over the quarter
In June, consumption of food products bounced back (+1.1% after –1.1% in May), as well as over the second quarter (+0.9%, after –0.9%).
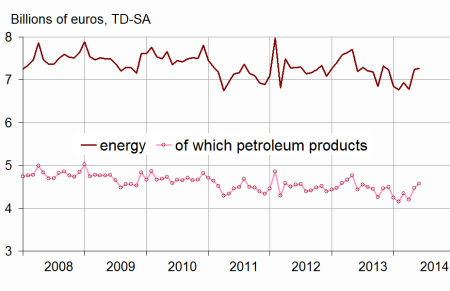
Energy: almost stable in June, increasing over the quarter
After a significant rise in May, household consumption of energy products leveled off in June (+0.2% after +7.0% in May), the fall in consumption of gas and electricity being offset by a rise in consumption of fuel products.
Over the quarter, consumption of energy products picked up (+3.5% after –3.9% in Q1).
The evolution in May is scaled down by 0.3 points
Household consumption of goods is now estimated at +0.7% in May, instead of +1.0% estimated for the previous publication.
This revision is mainly due to the integration of new information on car equipment, as well as the updating of the seasonal adjustment coefficients, notably in energy expenditure.
graphiquegraph4_new_ang – Energy
tableauenglish_trim – Household consumption expenditure on goods
| April | May | June | June2014/ | Q2 14/ | |
|---|---|---|---|---|---|
| 2014 | 2014 | 2014 | June2013 | Q1 14 | |
| Food products | 15.921 | 15.741 | 15.916 | ||
| Change (%) | 1.2 | –1.1 | 1.1 | 1.6 | 0.9 |
| Engineered goods | 19.766 | 19.735 | 19.921 | ||
| Change (%) | –0.1 | –0.2 | 0.9 | 2.3 | 0.1 |
| Durables | 9.874 | 9.790 | 9.844 | ||
| Change (%) | 0.8 | –0.9 | 0.5 | 3.4 | 1.0 |
| - Of which automobiles | 4.741 | 4.577 | 4.673 | ||
| Change (%) | 0.9 | –3.5 | 2.1 | 1.7 | 0.4 |
| - Of which household durables | 3.889 | 4.001 | 3.940 | ||
| Change (%) | 0.8 | 2.9 | –1.5 | 6.5 | 2.5 |
| Textile-leather | 3.924 | 3.960 | 4.081 | ||
| Change (%) | –1.6 | 0.9 | 3.0 | 2.1 | –2.0 |
| Other engineered goods | 5.974 | 5.988 | 5.996 | ||
| Change (%) | –0.4 | 0.2 | 0.1 | 0.7 | –0.1 |
| Energy | 6.775 | 7.247 | 7.261 | ||
| Change (%) | –2.4 | 7.0 | 0.2 | 0.9 | 3.5 |
| - Including petroleum products | 4.205 | 4.474 | 4.573 | ||
| Change (%) | –3.2 | 6.4 | 2.2 | 3.0 | 4.0 |
| Total | 42.430 | 42.742 | 43.112 | ||
| Change (%) | 0.0 | 0.7 | 0.9 | 1.8 | 1.0 |
| Manufactured goods | 36.494 | 36.310 | 36.765 | ||
| Change (%) | 0.1 | –0.5 | 1.3 | 2.0 | 0.5 |
Documentation
Methodology (pdf,23 Ko)
Pour en savoir plus
