


 25 March 2015
2015- n° 69In March 2015, the business climate has improved in the retail trade and in the trade
and repair of motor vehicles Monthly survey of retailing - March 2015
25 March 2015
2015- n° 69In March 2015, the business climate has improved in the retail trade and in the trade
and repair of motor vehicles Monthly survey of retailing - March 2015
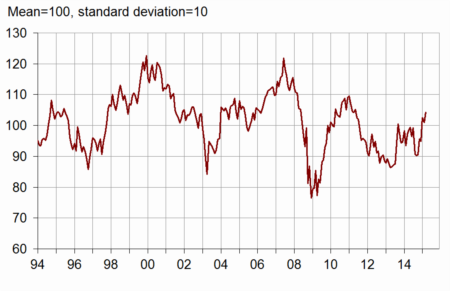
According to the managers surveyed in March 2015, the business climate has improved in the retail trade and in the trade and repair of motor vehicles. The corresponding synthetic indicator has increased by three points, reaching its mid-2011 level. It stays above its long term average.
According to the managers surveyed in March 2015, the business climate has improved in the retail trade and in the trade and repair of motor vehicles. The corresponding synthetic indicator has increased by three points, reaching its mid-2011 level. It stays above its long term average.
graphiquegraph_indsynt_en – Business climate synthetic indicator
Optimistic business outlook
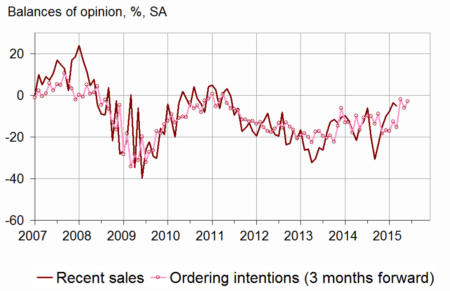
According to business leaders, recent sales have been nearly stable, the corresponding balance remaining above its mean level.
Each of the two balances concerning expected sales and ordering intentions has progressed and remains above its average. This progress is mainly due to the motor vhehicle trade. General business outlook are more optimistic too.
Stocks have still been estimated stable at their standard level.
Fewer business leaders than on the last interrogation have declared price falls over the last and over the next few months.
The cash position has been considered slightly more difficult.
graphiqueGraph_ventes_ic_en – Recent sales and ordering intentions
tableautab1_en – Global data
| Ave. (1) | Dec. 14 | Jan. 15 | Feb. 15 | March 15 | |
|---|---|---|---|---|---|
| Business climate | 100 | 95 | 103 | 101 | 104 |
| General business outlook | –30 | –38 | –31 | –33 | –28 |
| Recent sales | –8 | –10 | –8 | –3 | –5 |
| Expected sales | –3 | –7 | –3 | –2 | 5 |
| Ordering intentions | –9 | –15 | –2 | –6 | –3 |
| Stocks | 11 | 19 | 10 | 9 | 10 |
| Past selling prices (2) | –6 | –18 | –12 | ||
| Expected selling prices | –3 | –10 | –9 | –10 | –8 |
| Cash position (2) | –15 | –17 | –19 | ||
| Workforce size: recent trend | 0 | –4 | –4 | –2 | –6 |
| Workforce size: future trend | –3 | –6 | –9 | –8 | –5 |
- (1) Average since 1991 (2004 for recent and expected sales and ordering intentions).
- (2) Bi-monthly question (odd-numbered months).
- Source: monthly survey in the retail trade and in the trade and repair of motor vehicles - INSEE
Persistent pessimism about employment
The balance concerning recent trend on workforce size has slightly dropped, the future trend one has moderatly increased. Each of both has remained under its mean level.
Retail trade
Better past activity in non-specialised trade
In retail trade, recent sales balance has slightly declined. It has remained above its average in non-specialised trade but has stayed very low in specialised one.
In retail trade, forecasts have remained rather stable: the expected sales balance has slightly increased, mainly in non-specialised trade, and the balance concerning ordering intentions has been stable. Both balances stand a little over its long term average.
Stocks have been considered somewhat higher, and have come back to their standard level.
Fewer business leaders have declared price falls over the last few months. As many of them have anticipated some over the next few months.
The cash-flow situation has been estimated difficult.
Trade and repair of motor vehicles
Very optimistic forecasts
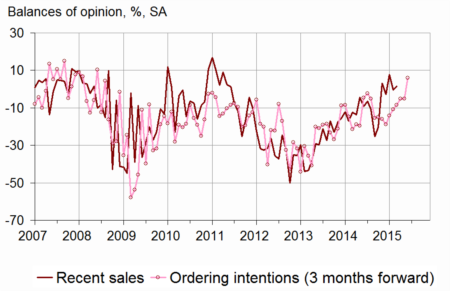
According to managers in the trade and repair of motor vehicles, sales have stayed dynamic, each of the balances concerning recent and expected sales being over its long term average. Expected sales and ordering intentions have sharply progressed: both balances have reached their mid-2008 level.
graphiquegraph_ventes_ic_auto_en – Recent sales and ordering intentions in motor vehicles
The level of stocks is considered lower, under its standard level from now on.
Both balances concerning past and expected prices have increased and gone over their averages.
The cash position has still been deemed more comfortable than its mean level.
tableautab2_en – Detailed data
| Ave. (1) | Dec. 14 | Jan. 15 | Feb. 15 | March 15 | |
|---|---|---|---|---|---|
| Retail trade - Global data | |||||
| Recent sales | –6 | –13 | –14 | –5 | –8 |
| Expected sales | –1 | –9 | –7 | 0 | 3 |
| Ordering intentions | –7 | –19 | –5 | –5 | –5 |
| Stocks | 10 | 20 | 7 | 6 | 10 |
| Past selling prices (2) | –8 | –26 | –19 | ||
| Expected selling prices | –5 | –15 | –14 | –13 | –14 |
| Cash position (2) | –13 | –18 | –18 | ||
| Workforce size: recent trend | 1 | –2 | –1 | 0 | –6 |
| Workforce size: future trend | –2 | –6 | –10 | –7 | –6 |
| Non-specialized retail trade | |||||
| Recent sales | –2 | 5 | –1 | 10 | 5 |
| Expected sales | 5 | 8 | –11 | 10 | 15 |
| Ordering intentions | 1 | –17 | –1 | 2 | 2 |
| Stocks | 7 | 23 | 0 | 6 | 12 |
| Past selling prices (2) | –8 | –25 | –25 | ||
| Expected selling prices | –5 | –10 | –8 | –11 | –13 |
| Cash position (2) | –7 | –11 | –10 | ||
| Specialized retail trade | |||||
| Recent sales | –10 | –34 | –29 | –21 | –23 |
| Expected sales | –8 | –21 | –17 | –16 | –15 |
| Ordering intentions | –17 | –22 | –24 | –15 | –16 |
| Stocks | 14 | 17 | 15 | 6 | 8 |
| Past selling prices (2) | –8 | –24 | –16 | ||
| Expected selling prices | –5 | –22 | –22 | –16 | –15 |
| Cash position (2) | –22 | –27 | –29 | ||
| Trade and repair of motor cars and motorcycles | |||||
| Recent sales | –11 | –3 | 8 | –1 | 1 |
| Expected sales | –9 | –3 | 2 | –6 | 12 |
| Ordering intentions | –13 | –9 | –5 | –5 | 6 |
| Stocks | 15 | 15 | 18 | 16 | 9 |
| Past selling prices (2) | 1 | 1 | 7 | ||
| Expected selling prices | 4 | –1 | –8 | –3 | 7 |
| Cash position (2) | –25 | –19 | –19 | ||
| Workforce size: recent trend | –10 | –14 | –15 | –10 | –4 |
| Workforce size: future trend | –8 | –10 | –7 | –6 | –2 |
- (1) Average since 1991 (2003 for trade and repair of motor vehicles and 2004 for recent and expected sales and ordering intentions).
- (2) Bi-monthly question (odd-numbered months).
- Source: monthly survey in the retail trade and in the trade and repair of motor vehicles - INSEE
Documentation
Methodology (pdf,129 Ko)
Pour en savoir plus
