


 26 November 2015
2015- n° 289In Q3 2015, prices of second hand dwelling rose slightly, and the upswing of transactions
strengthened Indexes of prices of second-hand dwellings - 3rd Quarter 2015
26 November 2015
2015- n° 289In Q3 2015, prices of second hand dwelling rose slightly, and the upswing of transactions
strengthened Indexes of prices of second-hand dwellings - 3rd Quarter 2015
During the third quarter of 2015, prices of second-hand dwellings were slightly increasing (+0.5% quarter-on-quarter according to provisional results, s.a. data), after an equivalent reduction in the previous quarter.
During the third quarter of 2015, prices of second-hand dwellings were slightly increasing (+0.5% quarter-on-quarter according to provisional results, s.a. data), after an equivalent reduction in the previous quarter.
However, year-on-year, prices of second-hand dwellings were decreasing (–1.5% compared to the third quarter of 2014). As since the beginning of 2015, the price fall is somewhat sharper for flats (–1.7%) than for houses (–1.4%). Between the middle of 2012 and the end of 2014, on the contrary, prices of houses had fallen more than prices of flats.
In Île-de-France, prices of second-hand dwellings picked up
In Ile-de-France, prices of second-hand dwellings picked up out in Q3 2015 (+0.8%, after –0.4%).
Year-on-year, prices were still decreasing, but the pace of decrease eased: –1.2% compared with Q3 2014, against –2.5% in the second quarter. This fall was hardly more important for flats (–1.3%) than for houses (–1.1%).
In provincial France, prices were sligtly increasing
In provincial France, prices of second-hand dwellings rose slightly in the third quarter 2015: +0.3% q-o-q, after –0.5%. As in Île-de-France, the annual decline eased: –1.7% compared with Q3 2014, against –2.8% in the second quarter. It remained more marked for flats (–2.1% y-o-y) than for houses (–1.4%).
graphiqueGraphique1a – Prices of second-hand dwellings
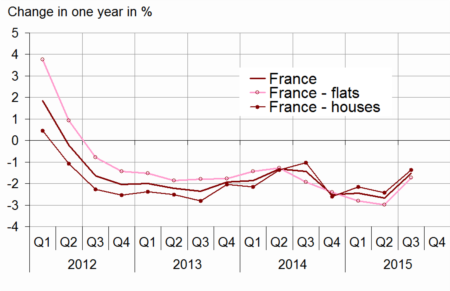
- Sources: INSEE, French notaries - Database Bien, Perval society
graphiqueGraphique2a – Prices of second-hand dwellings in Île-de-France
- Sources: INSEE, French notaries - Database Bien, Perval society
tableauTableau1a – Variation in prices of second-hand dwellings in metropolitan France
| change in | ||||||
|---|---|---|---|---|---|---|
| 3 months (S.A.) | 12 months | |||||
| 2015 Q1 | 2015 Q2 (sd) | 2015 Q3 (p) | 2015 Q1 | 2015 Q2 (sd) | 2015 Q3 (p) | |
| France | -0.3 | -0.5 | 0.5 | -2.4 | -2.7 | -1.5 |
| Flats | -0.6 | -0.6 | 0.4 | -2.8 | -3.0 | -1.7 |
| Houses | 0.0 | -0.4 | 0.5 | -2.2 | -2.4 | -1.4 |
- (p) : provisional
- (sd) : semi-definitive
- Sources: INSEE, French notaries - Database Bien, Perval society
Resumption of the annual volumes of transactions confirmed
The resumption of the annual volume of transactions, started in the beginning of 2015, was confirmed in the the third quarter: in September, it was estimated at 753,000 over the last 12 months, against 713,000 in June. This volume of transaction becomed higher than its level one year before (723,000 in September 2014, that is +4.2%).
This volume of transactions had sharply decreased in the second semester of 2014.
graphiqueGraphique3a – Volume of transactions of second-hand dwellings over the last 12 months
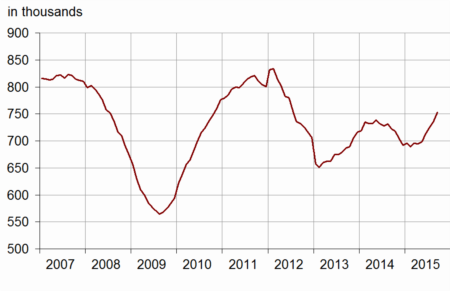
- Sources: CGEDD, based on notarial databases and DGFiP (MEDOC)
Revisions
The index is revised to include transactions recorded after the last publication. Furthermore, for this publication, the seasonal factors for Ile-de-France have been revised. This could marginally change the figures since the beginning of 2008. In comparison to the results released on 6th October, the change in prices in the second quarter of 2015 has been revised upwards (+0.1 points): +0.1 for houses, +0.2 for flats. The overall change in prices in Q2 2015 stands at –0.5%, instead of –0.6% (figure estimated on September 10th and not modified by the update on 6th October).
tableauTableau2a – Variation in prices of second-hand dwellings in metropolitan France
| Change in | ||||||
|---|---|---|---|---|---|---|
| 3 months (S.A.) | 12 months | |||||
| 2015 Q1 | 2015 Q2 (sd) | 2015 Q3 (p) | 2015 Q1 | 2015 Q2 (sd) | 2015 Q3 (p) | |
| Metropolitan France | -0.3 | -0.5 | 0.5 | -2.4 | -2.7 | -1.5 |
| - Flats | -0.6 | -0.6 | 0.4 | -2.8 | -3.0 | -1.7 |
| - Houses | 0.0 | -0.4 | 0.5 | -2.2 | -2.4 | -1.4 |
| Île-de-France | -0.9 | -0.4 | 0.8 | -2.5 | -2.5 | -1.2 |
| Provincial France | 0.0 | -0.5 | 0.3 | -2.4 | -2.8 | -1.7 |
| Flats | ||||||
| Île-de-France | -1.2 | -0.5 | 0.7 | -2.7 | -2.8 | -1.3 |
| - Paris | -0.9 | -0.4 | 0.9 | -2.8 | -2.9 | -0.9 |
| - Seine-et-Marne | -1.1 | 0.1 | -0.2 | -3.3 | -2.2 | -2.5 |
| - Yvelines | -2.6 | -0.9 | 0.9 | -3.1 | -3.8 | -2.2 |
| - Essonne | -0.7 | -0.4 | 0.2 | -3.8 | -3.6 | -2.4 |
| - Hauts-de-Seine | -1.7 | -0.7 | 0.9 | -2.1 | -2.3 | -1.0 |
| - Seine-Saint-Denis | -1.3 | -0.3 | 0.2 | -2.3 | -1.8 | -1.2 |
| - Val-de-Marne | -0.9 | -0.5 | 0.3 | -2.4 | -2.4 | -1.5 |
| - Val-d'Oise | -0.6 | -0.5 | -0.3 | -3.4 | -3.4 | -2.9 |
| Provincial France | -0.1 | -0.8 | 0.1 | -2.9 | -3.2 | -2.1 |
| - Conurbation > 10 000 inhabitants | -0.1 | -0.8 | ** | -2.9 | -3.2 | ** |
| - Central town | 0.1 | -0.9 | ** | -2.9 | -3.3 | ** |
| - Suburb | -0.5 | -0.6 | ** | -3.0 | -3.0 | ** |
| - Conurbation < 10 000 inhabitants | 0.1 | -0.4 | ** | -2.6 | -2.8 | ** |
| Houses | ||||||
| Île-de-France | -0.2 | -0.3 | 1.0 | -2.1 | -1.9 | -1.1 |
| - Seine-et-Marne | 0.4 | -0.2 | 0.5 | -1.9 | -1.7 | -1.2 |
| - Yvelines | -0.2 | 0.1 | 0.9 | -1.7 | -1.4 | -0.7 |
| - Essonne | 0.5 | -0.6 | 0.8 | -1.6 | -1.9 | -0.9 |
| - Hauts-de-Seine | -2.5 | 0.8 | 2.0 | -2.7 | -1.5 | -0.8 |
| - Seine-Saint-Denis | 1.1 | -2.3 | 1.5 | -2.6 | -3.6 | -1.7 |
| - Val-de-Marne | -0.5 | -0.6 | 1.1 | -2.5 | -2.3 | -1.2 |
| - Val-d'Oise | -0.2 | -0.2 | 0.6 | -2.4 | -1.8 | -1.2 |
| Provincial France | 0.1 | -0.4 | 0.4 | -2.2 | -2.5 | -1.4 |
| Nord-Pas de Calais | 1.3 | -1.4 | ** | -2.6 | -3.2 | ** |
| - Flats | 0.3 | 0.0 | ** | -5.5 | -4.9 | ** |
| - Houses | 1.5 | -1.7 | ** | -2.0 | -2.8 | ** |
Pour en savoir plus
