


 24 February 2015
2015- n° 38In February 2015, the business climate has slipped back just under its average in
the retail trade and in the trade and repair of motor vehicles Monthly survey of retailing - February 2015
24 February 2015
2015- n° 38In February 2015, the business climate has slipped back just under its average in
the retail trade and in the trade and repair of motor vehicles Monthly survey of retailing - February 2015
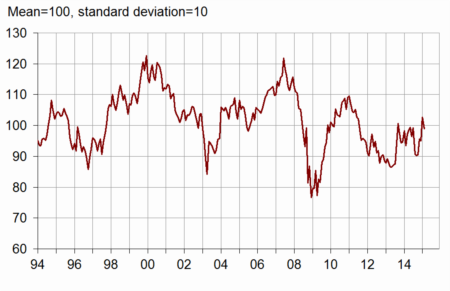
According to the managers surveyed in February 2015, the business climate has slipped back in the retail trade and in the trade and repair of motor vehicles. The corresponding synthetic indicator has lost four points, going down just under its mean level.
According to the managers surveyed in February 2015, the business climate has slipped back in the retail trade and in the trade and repair of motor vehicles. The corresponding synthetic indicator has lost four points, going down just under its mean level.
graphiquegraph_indsynt_en – Business climate synthetic indicator
Improvement of past activity but less dynamism in expected activity
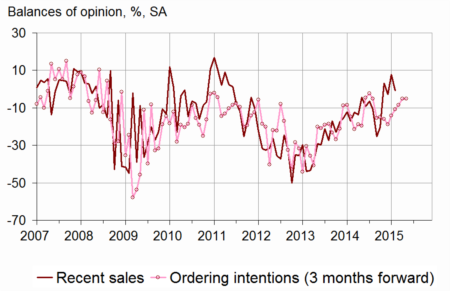
According to business leaders, recent sales have moderately increased. The corresponding balance has progressed for five months in a row and come back to its mid-2011 level, over its average. This rise is due to non-specialised retail trade.
Balances concerning expected sales, ordering intentions and general business outlook have slightly declined, each of them being near its average.
Stocks have been estimed stable at their standard level.
As many business leaders as in January have expected decreases in prices.
graphiqueGraph_ventes_ic_en – Recent sales and ordering intentions

tableautab1_en – Global data
| Ave. (1) | Nov. 14 | Dec. 14 | Jan. 15 | Feb. 15 | |
|---|---|---|---|---|---|
| Business climate | 100 | 96 | 95 | 103 | 99 |
| General business outlook | –30 | –37 | –38 | –31 | –33 |
| Recent sales | –8 | –15 | –10 | –8 | –4 |
| Expected sales | –3 | –9 | –7 | –3 | –4 |
| Ordering intentions | –9 | –12 | –15 | –2 | –8 |
| Stocks | 11 | 11 | 19 | 10 | 10 |
| Past selling prices (2) | –6 | –24 | –17 | ||
| Expected selling prices | –3 | –12 | –10 | –9 | –9 |
| Cash position (2) | –15 | –22 | –19 | ||
| Workforce size: recent trend | 0 | –7 | –4 | –4 | –4 |
| Workforce size: future trend | –3 | –9 | –6 | –9 | –10 |
- (1) Average since 1991 (2004 for recent and expected sales and ordering intentions).
- (2) Bi-monthly question (odd-numbered months).
- Source: monthly survey in the retail trade and in the trade and repair of motor vehicles - INSEE
Persistent pessimism about employment
The opinion of the business leaders on employment has remained deteriorated, over the last and over the next few months.
Retail trade
Better past activity in non-specialised trade
In non-specialised retail trade, recent sales have progressed, the corresponding balance, already above its average, becoming positive. Fewer specialised retailers than in January have indicated a drop in their past activity, however the balance has remained low.
In retail trade, forecasts remain medium: in February, each of the two balances concerning expected sales and ordering intentions has hardly changed and stands near its average.
Stocks have been estimed stable, under their standard level.
In specialised trade, fewer managers have expected falls in prices in the future.
Trade and repair of motor vehicles
Past and expected activities still over their averages
According to managers in the trade and repair of motor vehicles, past and expected sales have declined and ordering intentions have been stable. However, each of the three balances is still over its mean level.
graphiquegraph_ventes_ic_auto_en – Recent sales and ordering intentions in motor vehicles
The level of stocks is still considered slightly over its standard level.
Fewer vehicles leaders than in January have expected drops in prices on the next months.
tableautab2_en – Detailed data
| Ave. (1) | Nov. 14 | Dec. 14 | Jan. 15 | Feb. 15 | |
|---|---|---|---|---|---|
| Retail trade - Global data | |||||
| Recent sales | –6 | –22 | –13 | –14 | –5 |
| Expected sales | –1 | –13 | –9 | –7 | –3 |
| Ordering intentions | –7 | –13 | –19 | –5 | –8 |
| Stocks | 10 | 11 | 20 | 7 | 7 |
| Past selling prices (2) | –8 | –31 | –25 | ||
| Expected selling prices | –5 | –18 | –15 | –14 | –12 |
| Cash position (2) | –13 | –21 | –19 | ||
| Workforce size: recent trend | 1 | –5 | –2 | –1 | –1 |
| Workforce size: future trend | –2 | –10 | –6 | –10 | –10 |
| Non-specialized retail trade | |||||
| Recent sales | –2 | –14 | 5 | –1 | 8 |
| Expected sales | 5 | –4 | 8 | –11 | 5 |
| Ordering intentions | 1 | –3 | –17 | –1 | –4 |
| Stocks | 7 | 6 | 23 | 0 | 6 |
| Past selling prices (2) | –8 | –38 | –24 | ||
| Expected selling prices | –5 | –16 | –10 | –8 | –10 |
| Cash position (2) | –7 | –15 | –11 | ||
| Specialized retail trade | |||||
| Recent sales | –10 | –33 | –34 | –29 | –22 |
| Expected sales | –8 | –15 | –21 | –17 | –17 |
| Ordering intentions | –17 | –19 | –22 | –24 | –16 |
| Stocks | 14 | 16 | 17 | 15 | 7 |
| Past selling prices (2) | –8 | –24 | –24 | ||
| Expected selling prices | –5 | –20 | –22 | –22 | –15 |
| Cash position (2) | –22 | –27 | –28 | ||
| Trade and repair of motor cars and motorcycles | |||||
| Recent sales | –11 | 3 | –3 | 8 | –1 |
| Expected sales | –9 | –1 | –3 | 2 | –6 |
| Ordering intentions | –14 | –11 | –9 | –5 | –5 |
| Stocks | 15 | 13 | 15 | 18 | 18 |
| Past selling prices (2) | 1 | –7 | 3 | ||
| Expected selling prices | 4 | 3 | –1 | –8 | –4 |
| Cash position (2) | –26 | –23 | –23 | ||
| Workforce size: recent trend | –10 | –12 | –14 | –15 | –12 |
| Workforce size: future trend | –8 | –9 | –10 | –7 | –6 |
- (1) Average since 1991 (2003 for trade and repair of motor vehicles and 2004 for recent and expected sales and ordering intentions).
- (2) Bi-monthly question (odd-numbered months).
- Source: monthly survey in the retail trade and in the trade and repair of motor vehicles - INSEE
Documentation
Methodology (pdf,129 Ko)
Pour en savoir plus
