


 6 November 2015
2015- n° 271In the manufacturing industry, business managers forecast that investment will slightly
increase in 2016 after being steady in 2015 Industrial investment survey - October 2015
6 November 2015
2015- n° 271In the manufacturing industry, business managers forecast that investment will slightly
increase in 2016 after being steady in 2015 Industrial investment survey - October 2015
Surveyed in October 2015, business managers forecast investment in the manufacturing industry will remain stable in 2015 (+1%). They revised by 1 point downwards their previous expectations given in July 2015. This downward revision is notable in the sector of food products and beverages (–8 points).
- For 2016, investment in the manufacturing industry would increase slightly
- Business leaders that anticipated an increase between H2 2015 and H1 2016 are more numerous
- The investment revision indicator became negative
- Investment is stimulated by foreign-demand and the financial factors
- In 2016, the investment incentives are likely to be similar to those of 2015
Surveyed in October 2015, business managers forecast investment in the manufacturing industry will remain stable in 2015 (+1%). They revised by 1 point downwards their previous expectations given in July 2015. This downward revision is notable in the sector of food products and beverages (–8 points).
For 2016, investment in the manufacturing industry would increase slightly
On average over 2016, business leaders forecast a slight increase of 3% in their equipment spending compared with 2015. This increase would be notable in the manufacture of food products and beverages (+7%) and in the sector of electrical and electronic equipment, and machine equipment (+9%).
graphiqueGraph1_ang – Annual nominal change in investment in the manufacturing industry
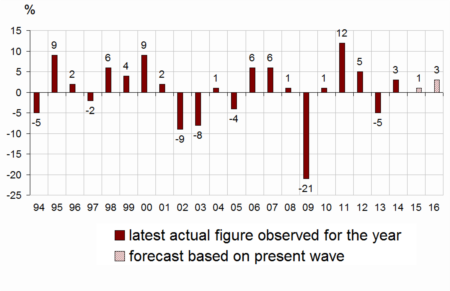
- Source: Industrial investment survey - INSEE
Business leaders that anticipated an increase between H2 2015 and H1 2016 are more numerous
More business leaders reported an increase between H1 2015 and H2 2015 than business leaders who reported a decrease. Business leaders that anticipated an increase between H2 2015 and H1 2016 were also slightly more numerous than business leaders that anticipated a decrease.
tableauTab1_ang – Real annual investment growth
| NA* : (A17) et [A38] | In 2015 | In 2016 | |
|---|---|---|---|
| forecast Jul.15 | forecast Oct.15 | forecast Oct.15 | |
| C : MANUFACTURING INDUSTRY | 2 | 1 | 3 |
| (C1): Manufacture of food products and beverages | 9 | 1 | 7 |
| (C3): Electrical and electronic equipment; machine equipment | –1 | –4 | 9 |
| (C4): Manufacture of transport equipment | 4 | 5 | –3 |
| [CL1]: Motor vehicles | 2 | –2 | –3 |
| (C5): Other manufacturing | 1 | 1 | 2 |
| Total sectors (C3-C4-C5) | 1 | 1 | 2 |
- How to read this table: In manufacturing industry, firms surveyed in October 2015 forecast an increase by 1% of their nominal investment in 2015 comparing to 2014 and an increase of 3% in 2016 comparing to 2015.
- * The codes correspond to the level of aggregation (A17) and [A38] of the "NA" aggregate classification based on NAF rev.2
- Source: Industrial investment survey - INSEE
graphiqueGraph2_ang – Six-month change in investment (first estimation)
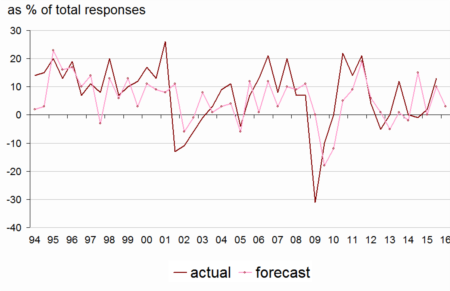
- Source: Industrial investment survey - INSEE
The investment revision indicator became negative
In October, for the first time since two years, the investment revision indicator has become negative which indicate that business managers were more numerous to revise downwards their expectations for 2015. Indicator’s calculation use investment amounts reported in at each survey by business leaders of the manufacturing industry (manufacture of food products and beverages and coke and refined petroleum products excepted).
graphiqueGraphIR_ang – Investment revision indicator
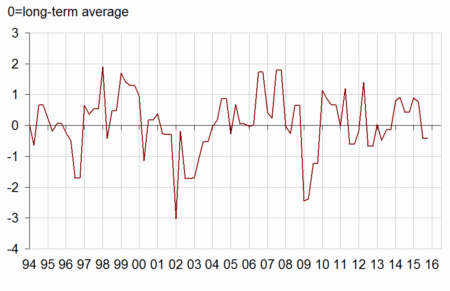
- Source: Industrial investment survey - INSEE
Investment is stimulated by foreign-demand and the financial factors
For 2015 and 2016, the foreign-demand outlook and the financial factors (cash flow, indebtedness, interest rates, overall financing conditions) are considered to be more stimulating: the balances of opinion are significantly above their long-term average. The domestic-demand outlook increases but the balances of opinion are lower than its long-term average.
tableauTab3o_ang – Factors influencing investment decisions
| Average | in 2015 | in 2016 | |
|---|---|---|---|
| 1991-2015 | actual | forecast | |
| Domestic-demand outlook | 49 | 45 | 47 |
| Foreign-demand outlook | 53 | 54 | 59 |
| Expected profits from new investment | 82 | 72 | 82 |
| Cash flow | 16 | 19 | 19 |
| Indebtedness | –3 | 6 | 7 |
| Interest rates | 7 | 32 | 28 |
| Overall financing conditions | 12 | 29 | 27 |
| Technical factors (1) | 63 | 61 | 62 |
| Other factors (such as tax incentives) | 23 | 31 | 29 |
- (1) Technological developments and need for labor to adjust to these new technologies
- For each factor, the balance of opinion is calculated as the difference between the percentage of stimulating answers and the percentage of limiting answers.
- Source: Industrial investment survey - INSEE
In 2016, the investment incentives are likely to be similar to those of 2015
In 2016, the purposes of investment will be similar to those of 2015. The share of investment meant to the replacement of equipment will remain slightly above its long-term average. On the contrary, the share of investment meant to increase productive capacity or purposed to introduction of new products is likely to remain below its long-term average.
tableauTab2_ang – Share of purposes of investment
| Average | 2015 | 2016 | |
|---|---|---|---|
| 1991-2015 | actual | forecast | |
| Replacement | 27 | 29 | 29 |
| Modernization, streamlining | 24 | 23 | 23 |
| of which : automation | 11 | 8 | 8 |
| of which : new production methods | 7 | 7 | 6 |
| of which : energy savings | 6 | 8 | 9 |
| increase in productive capacity | 16 | 15 | 14 |
| Introduction of new products | 14 | 13 | 13 |
| Other purposes (safety, environment, working conditions…) | 20 | 20 | 21 |
- Source: Industrial investment survey - INSEE
Documentation
Methodology (pdf,34 Ko)
Pour en savoir plus
Time series : Industry – Investment
