


 22 July 2015
2015- n° 180In July 2015, the business climate has improved in services Monthly survey of services - July 2015
22 July 2015
2015- n° 180In July 2015, the business climate has improved in services Monthly survey of services - July 2015
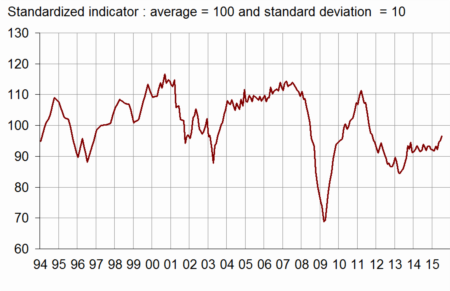
According to business managers, the economic situation in services has improved in July 2015. The business climate composite indicator has increased by two points and stands at 97, its highest level since October 2011, but it stays below its long-term average (100). The turning point indicator indicates a favourable momentum.
All services
According to business managers, the economic situation in services has improved in July 2015. The business climate composite indicator has increased by two points and stands at 97, its highest level since October 2011, but it stays below its long-term average (100). The turning point indicator indicates a favourable momentum.
Business leaders’ expectations are a little more optimistic: the balances on expected activity and demand, and that on general outlook, have increased again but they remain slightly below their long-term average. However, the balance on past activity is stable, below its long-term average.
The balance of opinion on the past operating balance result has decreased slightly since April, whereas the balance on the expected operating balance result has improved markedly. Both of the balances remain below their long-term level.
More business leaders consider that employment has increased, particularly in temporary work agencies. Nevertheless, the balance on expected employment is stable, close to its long-term average.
graphiqueGraph1 – Business climate composite indicator
graphiquegraph_retourn – Turning point indicator
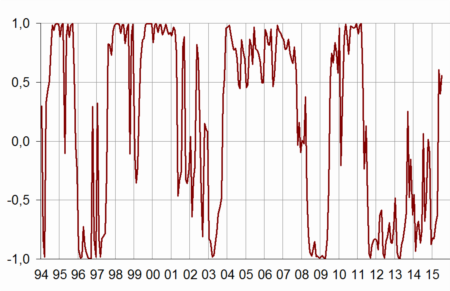
- Note: close to 1 (respectively -1), this indicator indicates a favourable short-term economic situation (respectively unfavourable).
tableauTable_quarter – Economic outlook in the services sector
| Average* | April 15 | May 15 | June 15 | July 15 | |
|---|---|---|---|---|---|
| Composite indicator | 100 | 92 | 95 | 95 | 97 |
| General outlook | –8 | –14 | –13 | –12 | –10 |
| Past activity | 2 | –8 | –5 | –8 | –8 |
| Expected activity | 2 | –9 | –6 | –4 | 1 |
| Expected demand | –1 | –6 | –5 | –6 | –4 |
| Past selling prices | –4 | –15 | –12 | –11 | –8 |
| Expected selling prices | –2 | –9 | –6 | –6 | –9 |
| Past employment | 2 | –8 | –4 | –4 | 3 |
| except temporary work agencies | 1 | –6 | –3 | –2 | –1 |
| Expected employment | 2 | –1 | 4 | 1 | 1 |
| except temporary work agencies | –1 | –3 | –2 | –3 | –4 |
| Investments | |||||
| Past investments | 1 | 6 | 4 | 3 | 1 |
| Expected investments | 1 | 2 | 4 | 1 | 4 |
| Operating balance result | |||||
| Past result | –2 | –10 | –12 | ||
| Expected result | –2 | –11 | –5 | ||
| Cash position | –11 | –15 | –13 | ||
| Difficulties of supply and demand | |||||
| difficulties of supply and demand | 10 | 12 | 12 | ||
| difficulties of supply only | 22 | 19 | 17 | ||
| difficulties of demand only | 32 | 38 | 37 | ||
| Difficulties in recruitment | 28 | 18 | 19 |
- * Average of the balances of opinion since 1988
- Source: Insee
Road transport
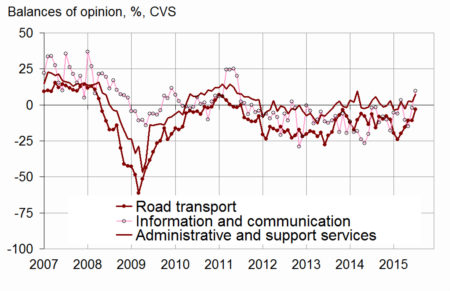
In road freight, business leaders’ balance of opinion on their past activity has fallen and stands below its long-term average. However, the balance on expected activity has increased strongly and stands above its long-term average. The anticipations on demand and employment have also increased slightly, above their long-term average.
Accommodation and food service activities
In accommodation and food service activities, more business managers than in June are pessimistic on past and expected activity. The corresponding balances stand below their long-term average. Whereas the balance on past employment has improved again, the balance on expected employment has gone down again.
Information and communication
In information and communication, the balances of opinion on past and expected activity have improved significantly. The anticipations of demand are more favourable. However, the balances on employment have gone down, diverging more from their long-term average.
Real estate
In real estate, the balance of opinion on past activity has fallen back below its long-term average. Nevertheless, the balance on expected activity has improved, even if it remains below its long-term average. The balances on employment have increased.
Professional, scientific and technical activities
In professional, scientific and technical activities, the balances on past and expected activity and employment are virtually stable, below their long-term average. Business managers’ anticipations on demand have come closer to their long-term average.
Administrative and support service activities
In administrative and support service activities, the balances of opinion on activity and demand have improved. They have reached their long-term average, and sometimes stand slightly above it. The balance on past and expected employment have recovered, particularly in temporary work agencies, and stand far above their long-term average.
graphiquegraph_bonus_ – Expected activity
tableauTable_det – Detailed data
| A21 | Average* | April 15 | May 15 | June 15 | July 15 |
|---|---|---|---|---|---|
| (H) Road transport | |||||
| Past activity | –8 | –23 | –6 | –3 | –18 |
| Expected activity | –10 | –16 | –11 | –11 | –3 |
| Expected demand | –13 | –12 | –14 | –12 | –11 |
| Past employment | –8 | –10 | –10 | –8 | –7 |
| Expected employment | –11 | –4 | –12 | –7 | –4 |
| (I) Accommodation and food service activities | |||||
| Past activity | –7 | –14 | –7 | –1 | –17 |
| Expected activity | –7 | –14 | –9 | –10 | –14 |
| Expected demand | –9 | –18 | –13 | –15 | –12 |
| Past employment | –4 | –6 | 3 | 8 | 10 |
| Expected employment | –5 | 6 | 9 | –8 | –14 |
| (J) Information and communication | |||||
| Past activity | 8 | –10 | –12 | –25 | –10 |
| Expected activity | 10 | –11 | –15 | –2 | 9 |
| Expected demand | 11 | 8 | 5 | 5 | 8 |
| Past employment | 6 | –6 | –5 | –4 | –9 |
| Expected employment | 10 | 3 | 3 | –1 | –3 |
| (L) Real estate activities | |||||
| Past activity | 7 | –2 | 1 | 13 | 5 |
| Expected activity | 7 | 2 | 11 | 0 | 4 |
| Expected demand | 1 | –9 | –1 | –5 | –6 |
| Past employment | 3 | –2 | –3 | –6 | 3 |
| Expected employment | 2 | –7 | –7 | –6 | –4 |
| (M) Professional, scientific and technical activities | |||||
| Past activity | –1 | –5 | –3 | –7 | –8 |
| Expected activity | –2 | –12 | –8 | –6 | –5 |
| Expected demand | –6 | –17 | –10 | –8 | –7 |
| Past employment | 1 | 1 | 1 | –2 | –2 |
| Expected employment | 0 | –7 | –4 | –4 | –3 |
| (N) Administrative and support service activities | |||||
| Past activity | 5 | –2 | –3 | –7 | 5 |
| Expected activity | 5 | –3 | 3 | 2 | 7 |
| Expected demand | 2 | 1 | 0 | –3 | 0 |
| Past employment | 8 | –8 | –3 | –2 | 19 |
| Expected employment | 6 | 3 | 14 | 10 | 16 |
- * Average of the balances of opinion since 1988 (2006 for road transport)
Documentation
Methodology (2016) (pdf,158 Ko)
Pour en savoir plus
Time series : Economic outlook surveys – Services
