


 15 July 2015
2015- n° 169In June 2015, prices of frequently purchased goods declined by 0.1% in hyper and supermarkets Price Index in large and predominantly-food stores - June 2015
15 July 2015
2015- n° 169In June 2015, prices of frequently purchased goods declined by 0.1% in hyper and supermarkets Price Index in large and predominantly-food stores - June 2015
In June 2015, prices of frequently purchased goods declined by 0.1% in hyper and supermarkets after remaining broadly unchanged during the two previous months.
In June 2015, prices of frequently purchased goods declined by 0.1% in hyper and supermarkets after remaining broadly unchanged during the two previous months.
In contrast, prices of frequently purchased goods increased very slightly in June 2015 (+0.1%) in the other sorts of stores, as in May. Considering all stores, they were stable in June 2015.
Year-on-year, in hyper and supermarkets, prices of frequently purchased decreased by 0.9%
Year-on-year, prices of frequently purchased goods decreased by 0.9% in hyper and supermarkets in June 2015, as in May. In June 2014, they had declined by 0.5%.
In large and predominantly food stores, decrease in prices of frequently purchased goods was in the same extent year-on-year (-0.9%, as in May).
Considering all stores, prices of frequently purchased goods were down in a lesser manner than in hyper and supermarkets (-0.4% year-on-year after -0.6% in May). They rose slightly (+0.4% year-on-year) excluding hyper and supermarkets and large and predominantly food stores.
graphiqueGraphique1English – Frequently purchased goods price indexes year-on-year change %
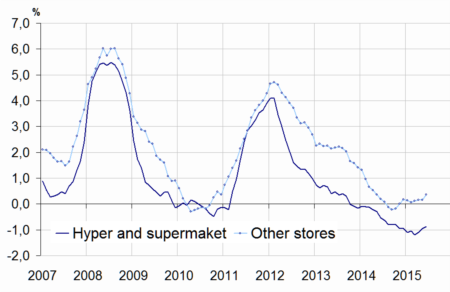
- Source: INSEE - Consumer Price Indexes
graphiqueGraphique2English – Frequently purchased goods price indexes
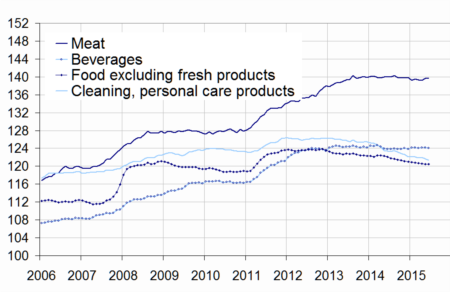
- Source: INSEE - Consumer Price Indexes
tableauTableau1English – Prices of frequently purchased goods
| Index | Changes (%) compared to | ||
|---|---|---|---|
| June 2015 | last month (m-o-m) | 12 months before (y-o-y) | |
| Hyper-and-Supermarkets (A) | 125.42 | -0.1 | -0.9 |
| Large and predominantly food stores (A + neighborhood stores) | 126.52 | 0.0 | -0.9 |
| Other stores | 135.98 | 0.1 | 0.4 |
| All stores | 128.67 | 0.0 | -0.4 |
- Source: Insee - Consumer Price Indexes
tableauTableau2English – Prices of frequently purchased goods detailed by main items
| Index | Changes (%) compared to | ||
|---|---|---|---|
| June 2015 | last month (m-o-m) | 12 months before (y-o-y) | |
| Food and beverages (excluding fresh foodstuffs) | 126.40 | 0.0 | -0.7 |
| - Meat | 139.75 | 0.1 | -0.2 |
| - Beverages | 124.06 | -0.1 | 0.1 |
| - Other food products | 120.46 | 0.0 | -1.3 |
| Clearing and personal care products | 121.36 | -0.3 | -1.6 |
| Total Hyper-and-Supermarkets | 125.42 | -0.1 | -0.9 |
- Source: INSEE - Consumer Price Indexes
The decline in food prices was alleviated again in hyper and supermarkets year-on-year
In June 2015, prices of food excluding fresh foodstuffs were broadly unchanged in hyper and supermarkets for the third month in a row. Year-on-year, they decreased by 0.7% (after -0.8% in May and -1.0% in April). In June 2014, they had declined by 0.3% year-on-year.
Variation by products were mixed.
Thus, prices of meat sold in hyper and supermarkets continued to recover again (+0,1 % after +0.3% in May). Year-on-year, they were down 0.2% (-0.3% in May). In June 2014, they had increased by 0.5% year-on-year.
In June, beverage prices diminished by 0.1% in hyper and supermarkets. Year-on-year, they increased slightly (+0.1% after +0.2% in May). In June 2014, they were down 0.4% year-on-year.
In June 2015, prices of other food products (excluding unprocessed foodstuffs) were stable in hyper and supermarkets, after decreasing during thirteen months in a row. Year-on-year, they dropped by 1.3% (-1.5% in May). In June 2014, they went down 0.6% year-on-year.
Continued decrease in prices of cleaning and personal care products
In June 2015, prices of cleaning and personal care products decreased again in hyper and supermarkets (-0.3% after -0.2% in May). Year-on-year, they declined by 1.6% (after -1.5% in May and -1.9% in June 2014).
Pour en savoir plus
