


 24 September 2015
2015- n° 233In September 2015, the business climate has gone down in services Monthly survey of services - September 2015
24 September 2015
2015- n° 233In September 2015, the business climate has gone down in services Monthly survey of services - September 2015
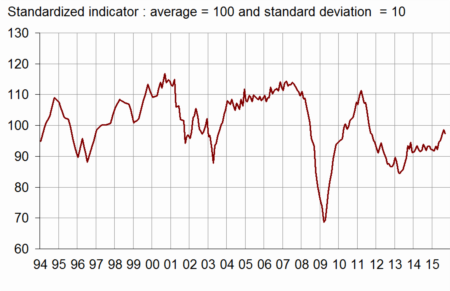
According to business managers, the business climate in services has gone down in September 2015. The business climate composite indicator has slipped from 99 to 97, below its long-term average (100). The turning point indicator remains in the favourable area.
All services
According to business managers, the business climate in services has gone down in September 2015. The business climate composite indicator has slipped from 99 to 97, below its long-term average (100). The turning point indicator remains in the favourable area.
graphiqueGraph1 – Business climate composite indicator
graphiquegraph_retourn – Turning point indicator
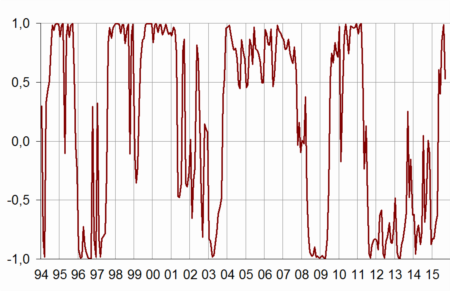
- Note: close to 1 (respectively -1), this indicator indicates a favourable short-term economic situation (respectively unfavourable).
The balance on the general outlook, which relates the assessment of business leaders over their whole sector, has recovered slightly.
The balance on past activity has improved slightly again. However, business leaders are more pessimistic than in August in their anticipations on activity and demand. The balance on expected activity has fallen below its long-term average.
The balance on past employment has fallen back, whereas the balance on expected employment is virtually stable. Both balances stand above their long-term average.
The balance on past investments is virtually stable, whereas the balance on expected investments has gone down. Both balances stay slightly above their long-term average.
tableauTable_quarter – Economic outlook in the services sector
| Average* | June 15 | July 15 | Aug. 15 | Sept. 15 | |
|---|---|---|---|---|---|
| Composite indicator | 100 | 95 | 97 | 99 | 97 |
| General outlook | –8 | –12 | –10 | –11 | –9 |
| Past activity | 2 | –8 | –7 | –5 | –3 |
| Expected activity | 2 | –4 | –1 | 2 | –3 |
| Expected demand | –1 | –6 | –3 | –2 | –4 |
| Past selling prices | –4 | –11 | –8 | –5 | –9 |
| Expected selling prices | –2 | –6 | –9 | –7 | –8 |
| Past employment | 2 | –4 | 7 | 9 | 6 |
| except temporary work agencies | 1 | –2 | 2 | 2 | 2 |
| Expected employment | 2 | 1 | 2 | 10 | 11 |
| except temporary work agencies | –1 | –3 | –3 | 0 | 2 |
| Investments | |||||
| Past investments | 1 | 3 | 2 | 3 | 4 |
| Expected investments | 1 | 1 | 3 | 5 | 2 |
- * Average of the balances of opinion since 1988, and since 2005 for the balances on investments
- Source: INSEE, business survey in services
Road transport
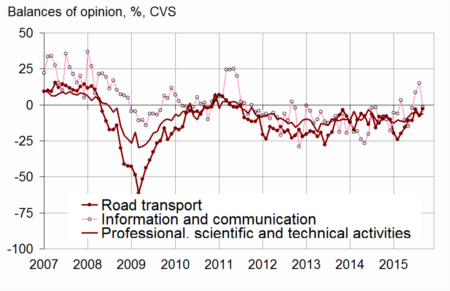
In road freight, the balances on past and expected activity have improved. However, the balances on past and expected employment have declined. Nevertheless, all the balances are still above their long-term average.
Accommodation and food service activities
In accommodation and food service activities, the balance on past activity has increased again. The balances on employment have gone up and stand well above their long-term average. However, the balances on expected activity and demand have fallen back significantly, the latter dropping below its long-term average.
Information and communication
In information and communication, the balance on past activity is stable. However, business leaders are far more pessimistic than in August in their expectations on activity and demand; the corresponding balances stand well below their long-term average. The balances on past and expected employment have gone down slightly.
Real estate
In real estate, the balance of opinion on past activity has recovered slightly. The balances on employment have improved. Nevertheless, expectations on activity and demand have deteriorated and the corresponding balances have fallen below their long-term average.
Professional, scientific and technical activities
In professional, scientific and technical activities, the balances of opinion on activity and demand have increased slightly. They remain below their long-term average.
Administrative and support service activities
In administrative and support service activities, the balances of opinion on past and expected activity have decreased slightly ; the balance on expected activity stands slightly below its long-term average. The balance on past employment has shrunk, whereas the balance on expected employment is almost stable. These two balances remain above their long-term average.
graphiquegraph_bonus_ – Expected activity in services
tableauTable_det – Detailed data
| A21 | Average* | June 15 | July 15 | Aug. 15 | Sept. 15 |
|---|---|---|---|---|---|
| (H) Road transport | |||||
| Past activity | –8 | –3 | –17 | –6 | –2 |
| Expected activity | –10 | –11 | –3 | –7 | –3 |
| Expected demand | –13 | –12 | –11 | –5 | –6 |
| Past employment | –8 | –8 | –7 | –3 | –6 |
| Expected employment | –11 | –7 | –3 | –3 | –9 |
| (I) Accommodation and food service activities | |||||
| Past activity | –7 | –1 | –15 | –4 | –1 |
| Expected activity | –7 | –10 | –15 | –3 | –6 |
| Expected demand | –9 | –15 | –10 | –7 | –17 |
| Past employment | –4 | 8 | 13 | 7 | 14 |
| Expected employment | –5 | –8 | –12 | 0 | 9 |
| (J) Information and communication | |||||
| Past activity | 8 | –25 | –11 | –10 | –10 |
| Expected activity | 10 | –2 | 9 | 15 | –2 |
| Expected demand | 11 | 5 | 10 | 5 | –4 |
| Past employment | 6 | –4 | –8 | –6 | –9 |
| Expected employment | 10 | –1 | –3 | 9 | 7 |
| (L) Real estate activities | |||||
| Past activity | 7 | 13 | 2 | 0 | 2 |
| Expected activity | 7 | 0 | 0 | 6 | –1 |
| Expected demand | 1 | –5 | –6 | 3 | –8 |
| Past employment | 3 | –6 | 3 | –2 | 2 |
| Expected employment | 2 | –6 | –4 | 1 | 6 |
| (M) Professional, scientific and technical activities | |||||
| Past activity | –1 | –7 | –8 | –5 | –4 |
| Expected activity | –2 | –6 | –5 | –7 | –6 |
| Expected demand | –6 | –8 | –6 | –9 | –7 |
| Past employment | 1 | –2 | 0 | 3 | 0 |
| Expected employment | 0 | –4 | –2 | –2 | –2 |
| (N) Administrative and support service activities | |||||
| Past activity | 5 | –7 | 7 | 12 | 8 |
| Expected activity | 5 | 2 | 7 | 6 | 4 |
| Expected demand | 2 | –3 | 1 | 3 | 4 |
| Past employment | 8 | –2 | 22 | 23 | 12 |
| Expected employment | 6 | 10 | 17 | 25 | 24 |
- * Average of the balances of opinion since 1988 (2006 for road transport)
Documentation
Methodology (2016) (pdf,158 Ko)
Pour en savoir plus
Time series : Economic outlook surveys – Services
