


 24 November 2015
2015- n° 283In November 2015, the business climate in services remains slightly above its long-term
average Monthly survey of services - November 2015
24 November 2015
2015- n° 283In November 2015, the business climate in services remains slightly above its long-term
average Monthly survey of services - November 2015
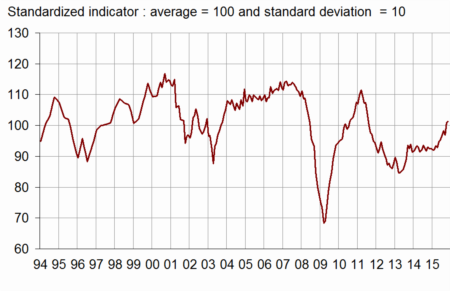
According to business managers, the business climate in services is stable in November 2015. The business climate composite indicator is above (101) its long-term average (100) for the second month in a row. The turning point indicator remains in the favourable area.

Warnings: 1. The results of this survey take into account answers until 19 November inclusive. The large majority of responses were registered before the attacks of 13 November.
2. In the survey of November 2015, the seasonal coefficients have been updated as well as the parameters of the composite indicator. As a result, the value of the set of results previously published in this survey may have changed.
All services
According to business managers, the business climate in services is stable in November 2015. The business climate composite indicator is above (101) its long-term average (100) for the second month in a row. The turning point indicator remains in the favourable area.
graphiqueGraph1 – Business climate composite indicator
graphiquegraph_retourn – Turning point indicator
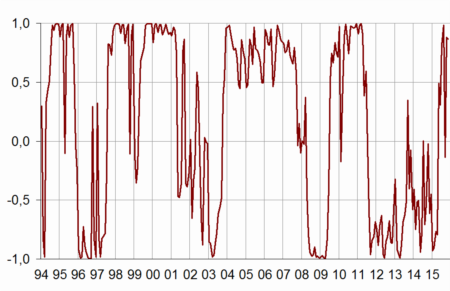
- Note: close to 1 (respectively –1), this indicator indicates a favourable short-term economic situation (respectively unfavourable).
The balance on the general outlook, which relates the assessment of business leaders over their whole sector, is unchanged slightly above its long-term average.
The balances on past and expected activity remain at the same level as last month. Whereas the balance on past activity is above its long-term average, the balance on expected activity stays slightly below. More business leaders than in October report an increase of expected demand. The corresponding balance is now above its long-term average.
The balance on past employment has increased. The balance on expected employment is virtually stable, although an improvement in services except temporary work agencies. Both balances stand clearly above their long-term average.
The balance on past investments has fell back moderately, whereas the balance on expected investments has improved. Both balances are above their long-term average.
tableauTable_quarter – Economic outlook in the services sector
| Average* | Aug. 15 | Sept. 15 | Oct. 15 | Nov. 15 | |
|---|---|---|---|---|---|
| Composite indicator | 100 | 98 | 97 | 101 | 101 |
| General outlook | –8 | –10 | –9 | –7 | –7 |
| Past activity | 2 | –4 | –3 | 4 | 4 |
| Expected activity | 2 | 1 | –3 | 1 | 1 |
| Expected demand | –1 | –3 | –5 | –2 | 2 |
| Past selling prices | –4 | –5 | –9 | –7 | –5 |
| Expected selling prices | –2 | –7 | –8 | –6 | –6 |
| Past employment | 3 | 9 | 4 | 10 | 14 |
| except temporary work agencies | 1 | 3 | 1 | 3 | 7 |
| Expected employment | 2 | 10 | 9 | 8 | 7 |
| except temporary work agencies | –1 | 0 | 1 | –1 | 3 |
| Investments | |||||
| Past investments | 1 | 3 | 4 | 8 | 6 |
| Expected investments | 1 | 4 | 1 | 2 | 4 |
- * Average of the balances of opinion since 1988
- Source: INSEE, business survey in services
Revisions
The business climate in services of October 2015 has been revised upward by one point since its first estimate last month. This slight revision comes from late businesses' answers which have been taken into account.
Road transport
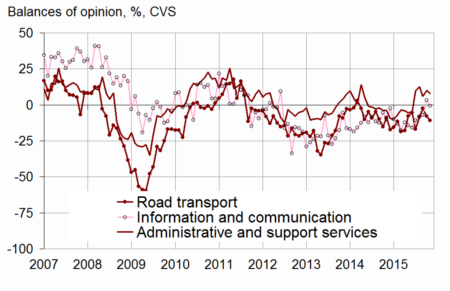
In road freight, the balance on past activity has decreased and has come back below its long-term average. However, the balances on expected activity and demand are virtually stable, above their long-term average. The balances on employment have improved again and stand clearly above their long-term average.
Accommodation and food service activities
In accommodation and food service activities, the balances on past and expected activity and on expected demand have recovered strongly and stand above their long-term average. Whereas the balance on past employment has also gone up, the balance on expected employment has decreased and has come back to its long-term average.
Information and communication
In information and communication, the balances on past and expected activity have declined. The balances on expected demand and on employment are virtually stable. All balances remain below their long-term average.
Real estate
In real estate, the balance of opinion on past activity has decreased slightly but it remains high. However, the balance on expected activity has gone down and has come back below its long-term average. The expectations of demand have recovered, and have hit their long-term average. The balances on employment are virtually stable and remain on a positive trend.
Professional, scientific and technical activities
In professional, scientific and technical activities, the balances of opinion on activity and demand are virtually stable and stand slightly above their long-term average. The balances on employment have improved and stand above their long-term average.
Administrative and support service activities
In administrative and support service activities, the balance of opinion on past activity has gone down slightly whereas the balance on expected activity has improved. The balance on expected demand has declined slightly. The balances on employment remain at a very high level even if the balance on expected employment has shrunk slightly.
graphiquegraph_bonus_ – Past activity in services
tableauTable_det – Detailed data
| A21 | Average* | Aug. 15 | Sept. 15 | Oct. 15 | Nov. 15 |
|---|---|---|---|---|---|
| (H) Road transport | |||||
| Past activity | –8 | –9 | –2 | –8 | –11 |
| Expected activity | –10 | –6 | –3 | –3 | –3 |
| Expected demand | –13 | –5 | –6 | –6 | –5 |
| Past employment | –8 | –3 | –6 | –4 | 5 |
| Expected employment | –11 | –4 | –9 | –4 | 0 |
| (I) Accommodation and food service activities | |||||
| Past activity | –7 | –6 | –5 | –3 | 4 |
| Expected activity | –7 | –6 | –3 | –8 | 5 |
| Expected demand | –9 | –7 | –20 | –9 | 9 |
| Past employment | –4 | 9 | 7 | 2 | 14 |
| Expected employment | –5 | –2 | 7 | –2 | –5 |
| (J) Information and communication | |||||
| Past activity | 8 | –8 | –7 | 3 | –1 |
| Expected activity | 10 | 11 | –1 | 3 | –4 |
| Expected demand | 11 | 5 | –2 | 3 | 3 |
| Past employment | 6 | –6 | –9 | 1 | 2 |
| Expected employment | 10 | 9 | 7 | 8 | 7 |
| (L) Real estate activities | |||||
| Past activity | 7 | 0 | 2 | 16 | 14 |
| Expected activity | 7 | 7 | –3 | 7 | 1 |
| Expected demand | 1 | 2 | –10 | –5 | 1 |
| Past employment | 3 | –2 | 1 | 7 | 7 |
| Expected employment | 2 | –1 | 4 | 10 | 9 |
| (M) Professional, scientific and technical activities | |||||
| Past activity | –1 | –4 | –4 | 4 | 3 |
| Expected activity | –2 | –7 | –4 | 0 | –1 |
| Expected demand | –6 | –9 | –7 | –4 | –4 |
| Past employment | 1 | 5 | 3 | 2 | 4 |
| Expected employment | 0 | –1 | 0 | –1 | 3 |
| (N) Administrative and support service activities | |||||
| Past activity | 5 | 13 | 6 | 10 | 8 |
| Expected activity | 5 | 5 | –1 | 5 | 7 |
| Expected demand | 2 | 3 | 3 | 5 | 3 |
| Past employment | 8 | 21 | 10 | 25 | 25 |
| Expected employment | 6 | 25 | 22 | 20 | 15 |
- * Average of the balances of opinion since 1988 (2006 for road transport).
Documentation
Methodology (2016) (pdf,158 Ko)
Pour en savoir plus
Time series : Economic outlook surveys – Services
