


 6 May 2015
2015- n° 109In the manufacturing industry, business managers forecast that investment will increase
by 7% in 2015 Industrial investment survey - April 2015
6 May 2015
2015- n° 109In the manufacturing industry, business managers forecast that investment will increase
by 7% in 2015 Industrial investment survey - April 2015
Surveyed in April 2015, business managers stated that investment in manufacturing industry increased by 2% in nominal value in 2014, in line with their previous expectations given last January.
Surveyed in April 2015, business managers stated that investment in manufacturing industry increased by 2% in nominal value in 2014, in line with their previous expectations given last January.
graphiqueGraph1_ang – Annual nominal change in investment in manufacturing industry
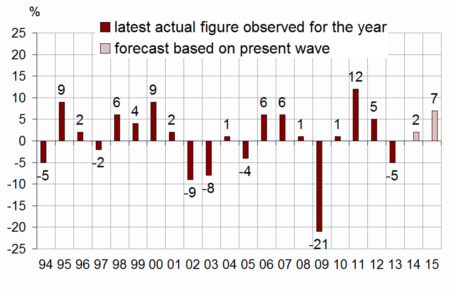
For 2015, business managers plan to invest more
For 2015, business managers in the manufacturing industry forecast that their investment will increase by 7%. They revised 4 points upwards their previous expectations given in January 2015. This upward revision concerns all sectors except that of electrical and electronic equipment, and machine equipment (–2 points). It should be notable in the sector of manufacture of transport equipment (+9 points). It is likely to be less important in the manufacture of food products and beverages (+4 points) and for the other manufacturing (+3 points).
tableauTab1_ang – Real annual investment growth
| NA* : (A17) and [A38] | 2014 | 2015 | ||
|---|---|---|---|---|
| estimate Jan.15 | observed Apr.15 | estimate Jan.15 | estimate Apr.15 | |
| MANUFACTURING INDUSTRY | 2 | 2 | 3 | 7 |
| (C1): Manufacture of food products and beverages | 3 | 3 | 1 | 5 |
| (C3): Electrical and electronic equipment; machine equipment | 3 | 4 | 1 | –1 |
| (C4): Manufacture of transport equipment | 2 | 5 | 5 | 14 |
| [CL1]: Motor vehicles | 5 | 6 | 10 | 15 |
| (C5): Other manufacturing | 2 | 0 | 4 | 7 |
| Total sectors C3-C4-C5 | 2 | 2 | 4 | 7 |
- How to read this table : In manufacturing industry, firms surveyed in April 2015 observed an increase by 2% of their nominal investment in 2014 comparing to 2013 and forecast an increase of 7% in 2015 comparing to 2014.
- * The codes correspond to the level of aggregation (A17) and [A38] of the "NA" aggregate classification based on NAF rev.2.
Investment leaders anticipate an increase in their investment in H2 2015
Business leaders that anticipated an increase between H2 2014 and H1 2015 were roughly as numerous as those who anticipated a decrease. From now on, more business managers anticipate a rise than a fall in their investment. The balance of opinion (+10) is above its long-term average (+5).
graphiqueGraph2_ang – Six-month change in investment (first estimation)
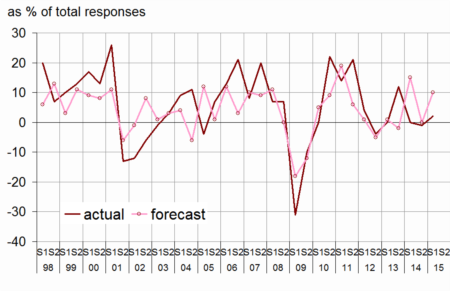
- How to read this graph: In April 2015, business leaders who anticipated an increase between H2 2014 and H1 2015 were roughly as numerous as those who anticipated a decrease ("actual"). More business leaders also anticipated an increase than a decrease in their investment between H1 2015 and H2 2015 ("forecast").
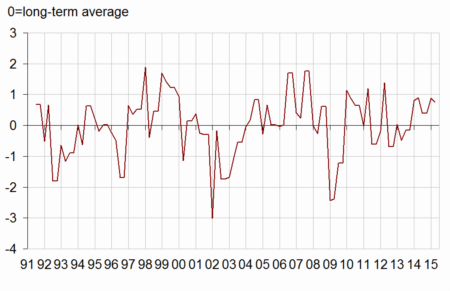
In April, the investment revision indicator stays positive
The investment revision indicator stays positive in April. Based on investment amounts reported in at each survey by business leaders of the manufacturing industry except those of manufacture of food products and beverages (C1) and of coke and refined petroleum products (C2), this indicator is well-correlated with the quarterly growth of gross fixed capital formation of non-financial enterprises.
graphiqueGraphIR_ang – Investment revision indicator
Investment mainly supports the replacement and modernization of equipment
In 2015, the purposes of investment will be quite similar to those of 2014. The share of investment purposed to replacement or to modernization should be above its long-term average. On the contrary, the share of investment meant to increase productive capacity or purposed to introduction of new products is likely remain below its long-term average.
tableauTab2_ang – Share of purposes of investment
| Average | 2014 | 2015 | |
|---|---|---|---|
| 1991-2015 | observed | forecast | |
| Replacement | 27 | 29 | 28 |
| Modernization, streamlining | 24 | 24 | 25 |
| of which : automation | 11 | 9 | 9 |
| of which : new production methods | 7 | 7 | 7 |
| of which : energy savings | 6 | 8 | 9 |
| increase in productive capacity | 16 | 15 | 14 |
| Introduction of new products | 14 | 12 | 12 |
| Other purposes (safety, environment, working conditions…) | 20 | 20 | 21 |
The forecasted share of equipment scrapping for wear and tear, and obsolescence in 2015 is higher than the forecast for 2014 (51%). It has reached a level (56%) notably above its long-term average (49%). On the contrary, the forecasted share of scrapping due to shut-down of capacity for old products (9%) stays below its average (12%).
tableauTab3a_ang – Productive capacity and equipment scrapping
| Observed | Forecast | ||||
|---|---|---|---|---|---|
| aver. | in 2014 | aver. | for 2014 | for 2015 | |
| Change in productive capacity* | 30 | 12 | 31 | 19 | 21 |
| Change in equipment scrapping* | 18 | 12 | –2 | –4 | 16 |
| Share of enterprises reporting equipment scrapping** | 76 | 65 | 75 | 65 | 66 |
| Breakdown of enterprises reporting equipment scrapping** | |||||
| Wear and tear, obsolescence | 52 | 60 | 49 | 51 | 56 |
| Installation of more efficient equipment | 31 | 31 | 33 | 35 | 32 |
| Shut-down of capacity for old products | 12 | 6 | 12 | 12 | 9 |
| Other scrapping | 5 | 3 | 6 | 2 | 3 |
| Total | 100 | 100 | 100 | 100 | 100 |
Documentation
Methodology (pdf,34 Ko)
Pour en savoir plus
Time series : Industry – Investment
