


 23 June 2015
2015- n° 152In June 2015, the business climate remains stable in services Monthly survey of services - June 2015
23 June 2015
2015- n° 152In June 2015, the business climate remains stable in services Monthly survey of services - June 2015
According to business managers, the business climate in services is stable in June 2015 after an increase of 3 points in May. The business climate composite indicator stands at 95; this level is below its long-term average (100). The turning point indicator is in the uncertainty area.
All services
According to business managers, the business climate in services is stable in June 2015 after an increase of 3 points in May. The business climate composite indicator stands at 95; this level is below its long-term average (100). The turning point indicator is in the uncertainty area.
The balance on the general outlook, which relates the assessment of business leaders over their whole sector, has increased slightly again but remains below its long-term average.
graphiqueGraph1 – Business climate composite indicator

graphiquegraph_retourn – Turning point indicator

- Note: close to 1 (respectively -1), this indicator indicates a favourable short-term economic situation (respectively unfavourable).
The balance on past activity has gone down significantly whereas the balance on expected activity has improved again. Both of the balances remain below their long-term average.
The balance on past employment is virtually stable; the balance on expected employment has fallen below its long-term average.
The balance on past investments is almost stable and stays above its long-term average, whereas the balance on expected investments has decreased and has returned to its long-term level.
tableauTable_quarter – Economic outlook in the services sector
| Average* | March 15 | April 15 | May 15 | June 15 | |
|---|---|---|---|---|---|
| Composite indicator | 100 | 93 | 92 | 95 | 95 |
| General outlook | –8 | –16 | –14 | –13 | –12 |
| Past activity | 2 | –13 | –8 | –5 | –9 |
| Expected activity | 2 | –5 | –9 | –6 | –4 |
| Expected demand | –1 | –6 | –6 | –5 | –6 |
| Business situation | –3 | –9 | –8 | –5 | –7 |
| Past selling prices | –4 | –12 | –15 | –12 | –11 |
| Expected selling prices | –2 | –10 | –9 | –6 | –6 |
| Past employment | 2 | –9 | –8 | –4 | –5 |
| except temporary work agencies | 1 | –7 | –6 | –3 | –2 |
| Expected employment | 2 | –4 | –1 | 4 | 0 |
| except temporary work agencies | –1 | –9 | –3 | –2 | –4 |
| Investments | |||||
| Past investments | 1 | 0 | 6 | 4 | 3 |
| Expected investments | 1 | –2 | 2 | 4 | 1 |
- * Average of the balances of opinion since 1988
- Source: INSEE
Revisions
The business climate in services of May 2015 has been revised upward by one point since its first estimate last month. This revision comes from late answers which have been taken into account.
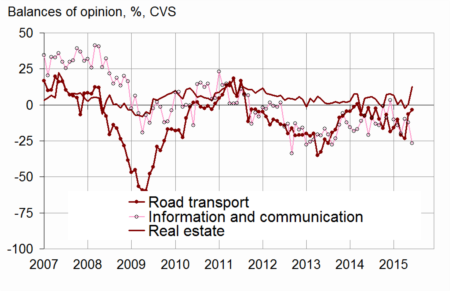
Road transport
In road freight, more business leaders than in May consider that their activity has increased. However, their anticipations of activity and demand are a little more pessimistic. The balance on expected employment has recovered and stands above its long-term average.
Accommodation and food service activities
In accommodation and food service activities, the balances of opinion on past and expected activity have improved again and stand above their long-term average. Business leaders’ expectations on demand are stable, below their long-term level. The balance on past employment is well oriented, but the balance on expected employment has fallen and stands below its long-term average.
Information and communication
In information and communication, the balance on past activity has fallen. On the contrary, the balance on expected activity has improved strongly. The balances on employment remain well below their long-term level.
Real estate
In real estate, the balance of opinion on past activity has improved strongly whereas the balance on expected activity has gone down markedly. Business leaders’ anticipations on demand are quasi stable, slightly below their long-term average. The balances on past and expected employment remain low.
Professional, scientific and technical activities
In professional, scientific and technical activities, the balance of opinion on past activity has decreased. The expectations on activity and demand have improved slightly but they remain below their long-term average.
Administrative and support service activities
In administrative and support service activities, the balance of opinion on past activity has decreased again. The anticipations on activity and demand stay below their long-term level. The balance of opinion on expected employment has gone down significantly but it remains above its long-term average.
graphiquegraph_bonus_ – Past activity
tableauTable_det – Detailed data
| A21 | Average* | March 15 | April 15 | May 15 | June 15 |
|---|---|---|---|---|---|
| (H) Road transport | |||||
| Past activity | –8 | –21 | –23 | –6 | –4 |
| Expected activity | –10 | –20 | –16 | –11 | –13 |
| Expected demand | –13 | –24 | –12 | –14 | –15 |
| Past employment | –8 | –9 | –10 | –10 | –8 |
| Expected employment | –11 | –18 | –4 | –12 | –8 |
| (I) Accommodation and food service activities | |||||
| Past activity | –7 | –26 | –14 | –7 | –1 |
| Expected activity | –7 | –14 | –14 | –9 | –6 |
| Expected demand | –9 | –2 | –18 | –13 | –13 |
| Past employment | –4 | –20 | –6 | 3 | 4 |
| Expected employment | –5 | –13 | 6 | 9 | –9 |
| (J) Information and communication | |||||
| Past activity | 9 | –20 | –10 | –12 | –27 |
| Expected activity | 10 | 3 | –11 | –15 | –4 |
| Expected demand | 11 | 4 | 8 | 5 | 6 |
| Past employment | 6 | –3 | –6 | –5 | –5 |
| Expected employment | 11 | 0 | 3 | 3 | 0 |
| (L) Real estate activities | |||||
| Past activity | 7 | 4 | –2 | 1 | 13 |
| Expected activity | 7 | 12 | 2 | 11 | 1 |
| Expected demand | 1 | –4 | –9 | –1 | –2 |
| Past employment | 3 | –2 | –2 | –3 | –5 |
| Expected employment | 2 | 9 | –7 | –7 | –6 |
| (M) Professional, scientific and technical activities | |||||
| Past activity | –1 | –14 | –5 | –3 | –7 |
| Expected activity | –2 | –11 | –12 | –8 | –6 |
| Expected demand | –6 | –16 | –17 | –10 | –9 |
| Past employment | 1 | –5 | 1 | 1 | 0 |
| Expected employment | 0 | –6 | –7 | –4 | –5 |
| (N) Administrative and support service activities | |||||
| Past activity | 5 | –1 | –2 | –3 | –8 |
| Expected activity | 5 | 2 | –3 | 3 | 1 |
| Expected demand | 2 | –3 | 1 | 0 | –3 |
| Past employment | 8 | –8 | –8 | –3 | –3 |
| Expected employment | 6 | 7 | 3 | 14 | 9 |
- * Average of the balances of opinion since 1988 (2006 for road transport)
Documentation
Methodology (2016) (pdf,158 Ko)
Pour en savoir plus
Time series : Economic outlook surveys – Services
