


 10 July 2014
2014- n° 160The Consumer Prices Index remained stable in June 2014; it rose by 0.5%, year-on-year Consumer price index - final results - June 2014
10 July 2014
2014- n° 160The Consumer Prices Index remained stable in June 2014; it rose by 0.5%, year-on-year Consumer price index - final results - June 2014
In June 2014, the Consumer Prices Index (CPI) remained almost unchanged for the third consecutive month. It grew by 0.5% in the year to June 2014, down from +0.7% in April and May 2014. This decrease in the annual growth rate is, partly (for less than 0.1 point), due to a time lag of the price collection that included a higher number of days during the summer sales in June this year than last year. This time lag affected particularly the clothing and footwear price collection. Overall, in June 2014, the drop in manufactured product prices has been offset by a seasonal increase in prices of services which occurs usually before the summer holidays. Moreover, prices of food and those of energy declined in June 2014.
Monthly change: 0.0%; Year-on-year: +0.5%
In June 2014, the Consumer Prices Index (CPI) remained almost unchanged for the third consecutive month. It grew by 0.5% in the year to June 2014, down from +0.7% in April and May 2014. This decrease in the annual growth rate is, partly (for less than 0.1 point), due to a time lag of the price collection that included a higher number of days during the summer sales in June this year than last year. This time lag affected particularly the clothing and footwear price collection. Overall, in June 2014, the drop in manufactured product prices has been offset by a seasonal increase in prices of services which occurs usually before the summer holidays. Moreover, prices of food and those of energy declined in June 2014.
Seasonal increase in the price of services
Prices of services increased by 0.2% in June 2014, mainly due to the seasonal price increases at the beginning of the summer holidays. Thus, prices of accomodation services went up by 3.8% in June 2014 (+2.5% year-on-year). Those of rentals for holiday residences were up 2.3% (+0.8% year-on-year). Similarly, air fares bounced back (+5.0% compared to May 2014; +0.7% in the year to June 2014). Conversely, also in a seasonal manner, the prices of package holidays fell in June 2014 (—8.7%, +1.0% year-on-year) after the spring holidays and before the summer holidays. Moreover, prices of health services rose slightly in June 2014 (+0.2% compared to May 2014 and in the year to June 2014) while the prices of phone services slowed down (—0.1% in June 2014; +1.1 % year-on-year after +1.4% in May 2014). All in all, service prices grew by 1.8% year-on-year in June 2014, as in May 2014.
tableauOLE_LINK2 – Detailed figures for various groups
| Percentage change | ||||
|---|---|---|---|---|
| Items | Weight 2014 | Index June 2014 | Month rate | Annual rate |
| a) All households - France | ||||
| All items (00 E) | 10000 | 128.14 | 0.0 | 0.5 |
| All items SA (00 C) | 10000 | 127.79 | 0.0 | 0.5 |
| Food (4000 E) | 1653 | 132.17 | -0.2 | -1.5 |
| Fresh food (4001 E) | 210 | 140.68 | -0.8 | -10.6 |
| Food excluding fresh products (4002 E) | 1443 | 130.96 | -0.1 | -0.1 |
| Tobacco (4034 E) | 204 | 258.56 | 0.0 | 6.9 |
| MANUFACTURED PRODUCTS (4003 E) | 2653 | 100.65 | -0.4 | -1.2 |
| Clothing and footwear (4004 E) | 438 | 110.25 | -1.5 | -1.5 |
| Medical products (4005 E) | 434 | 78.41 | -0.3 | -2.8 |
| Other manufactured products (4006 E) | 1781 | 103.98 | -0.2 | -0.7 |
| ENERGY (4007 E) | 850 | 178.54 | -0.1 | 1.0 |
| Petroleum products (4008 E) | 475 | 202.32 | 0.3 | -1.3 |
| SERVICES (4009 E) | 4640 | 136.05 | 0.2 | 1.8 |
| Actual rentals and services for dwellings (4010 E) | 748 | 141.42 | 0.0 | 1.5 |
| Medical services (4011 E) | 552 | 122.46 | 0.2 | 0.2 |
| Transport and communication services (4012 E) | 503 | 96.28 | 0.8 | 1.7 |
| Other services (4013 E) | 2837 | 146.86 | 0.2 | 2.2 |
| ALL ITEMS EXCLUDING RENTALS AND TOBACCO (5000 E) | 9202 | 125.59 | 0.0 | 0.3 |
| ALL ITEMS EXCLUDING TOBACCO (4018 E) | 9796 | 126.22 | 0.0 | 0.3 |
| b) Manual or clerical worker headed urban households - France | ||||
| ALL ITEMS EXCLUDING TOBACCO (4018 D) | 9707 | 125.99 | 0.0 | 0.3 |
| ALL ITEMS (00 D) | 10000 | 128.79 | 0.0 | 0.5 |
| c) Households that belong to the lowest equivalized disposable income quintile - France | ||||
| ALL ITEMS EXCLUDING TOBACCO (4018 Q) | 9679 | 127.33 | 0.0 | 0.3 |
- Source : Insee - Consumer Price Indexes
tableauTableau1English – Detailed figures for Core inflation* and HICP**
| Percentage change | ||||
|---|---|---|---|---|
| Items | Weight 2014 | Index June 2014 | Month rate | Annual rate |
| All items "Core inflation" (4022 S) | 6053 | 122.25 | -0.1 | 0.1 |
| Food excluding fresh products, meat, milk and exotic products (4019 S) | 713 | 125.14 | -0.1 | -0.8 |
| Manufactured products (4020 S) | 2162 | 104.46 | -0.4 | -1.2 |
| Services including actual rentals and services for dwellings (4021 S) | 3178 | 139.12 | 0.1 | 1.2 |
| All items HICP (00 H) | 115.87 | 0.0 | 0.6 | |
- * ISJ : Core inflation indicator excludes public sector prices, the most volatile consumer prices and tax measures. Seasonally adjusted, this index is computed for all households in France excluding overseas departments and territories (base 100 1998).
- **HICP : Harmonized Indices of Consumer Prices are inflation figures designed for international comparison of consumer price inflation between Member states of the European Union. This index is computed for all households in France (base 100 2005).
- Source : Insee - Consumer Price Indexes
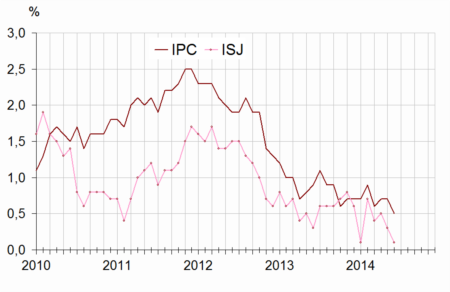
graphiqueGraphique1English – Consumer price index (IPC) and Core inflation (ISJ) – year-on-year changes
- Source : Insee - Consumer Price Indexes
Large decrease in manufactured good prices
In June 2014, prices of manufactured products fell by 0.4%. This decrease was partly linked to a time lag in the price collection calendar, which included a higher number of days during the summer sales in June this year than last year. This have significantly contributed to the fall of the prices of clothing-footwear (—1.5% in the year to June 2014, after +0.2% year-on-year in May 2014). For other manufactured goods, the effect of the summer sales is less marked in June 2014, some of these products had already been the subject of promotions in May while for others, their prices are always submitted to a downward trend (especially audio-visual, photographic and information processing equipments). In addition, the decline in health product prices continued (—0.3% ; —2.8% year-on-year).
Significant drop in food prices
Overall, food prices decreased in June 2014 by 0.2% compared to May 2014 and by 1.5% year-on-year. The decline in the prices of unprocessed food has continued unabated (—0.8% in June 2014; —10.6% from June 2013) mainly due to an abundant supply itself related to favorable weather conditions at the start of this year. The fall in prices was particularly significant for vegetables and fruits (respectively —9.9% and —14.5% in the year to June 2014). In addition, excluding fresh products, the prices of the other foodstuffs which had already lost any momemtum since the end of last year, declined slightly in June 2014 (—0.1% compared to May 2014 and year-on-year). For some food items, the fall of prices has been strong compared with the same month one year ago (—2.1% for non-alcoholic beverages as well as for sugar, jam, honey, chocolate and confectionery; —1.9% for eggs, cakes and industrial pastries and —1.6% for cereal preparations).
Slight decline in energy prices
Energy prices declined by 0.1% in June 2014, as in May 2014. In June, this decline was due to a new decrease in city gas prices (—1.5% after —0.7% in May 2014; —1.4% year-on-year). Prices of petroleum products rose slightly (+0.3% in June 2014 and —1.3% year-on-year), for both motor fuels and heating fuels. Electricity prices were unchanged in June 2014 and rose by 6.9% compared with the same month one year ago.
Core inflation declined again
In June 2014, the core inflation indicator (ISJ) decreased by 0.1% compared to May 2014. Its annual rate of change fell to +0.1% in June 2014, down from +0.3% in May 2014, partly due to a time lag in the price collection calendar (see above). The Harmonized Index of Consumer Prices (HICP) remained stable in June 2014 and decreased year-on-year to +0.6%, down from +0.8% in May 2014.
Pour en savoir plus
