


 31 July 2015
2015- n° 186Increasing in June (+0.4%), household consumption of goods was almost stable over
the second quarter of 2015 (–0.1%) Household consumption expenditure on goods - June 2015
31 July 2015
2015- n° 186Increasing in June (+0.4%), household consumption of goods was almost stable over
the second quarter of 2015 (–0.1%) Household consumption expenditure on goods - June 2015
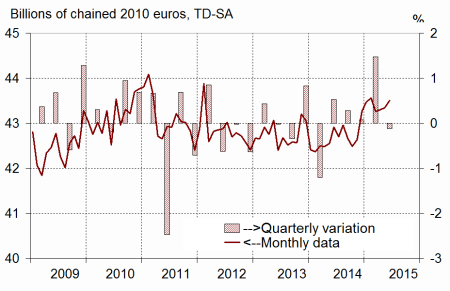
In June 2015, household consumption expenditure on goods accelerated: +0.4% in volume*, after +0.1% in May. This acceleration was mainly attributable to the dynamism of food consumption (+0.6% in June after +0.0% in May). However, over the second quarter, household expenditure on goods was almost stable (–0.1%) after a wide increase over the first quarter (+1.5%) : the decline in consumption of energy (–2.2%) offset the dynamism of food consumption (+0.8%).
- Engineered goods : increasing in June, stable over the quarter
- Durables: slowing in June and over the quarter
- Textile-leather: increasing in June, decreasing over the quarter
- Other engineered goods: moderate rise in June
- Food products: acceleration in June and over the quarter
- Energy: downturn over the quarter
- The variation in May remains unchanged
In June 2015, household consumption expenditure on goods accelerated: +0.4% in volume*, after +0.1% in May. This acceleration was mainly attributable to the dynamism of food consumption (+0.6% in June after +0.0% in May). However, over the second quarter, household expenditure on goods was almost stable (–0.1%) after a wide increase over the first quarter (+1.5%) : the decline in consumption of energy (–2.2%) offset the dynamism of food consumption (+0.8%).
Engineered goods : increasing in June, stable over the quarter
Durables: slowing in June and over the quarter
Household expenditure on durable goods decelerated slightly in June (+0.4% after +0.7% in May). Expenditure on household durables went up (+0.4%), after two sluggish months, and car purchases accelerated slightly (+0.7% after +0.5% in May). By contrast, purchases of other durables declined markedly (–0.7% after +2.9%), notably in watch/jewellery.
Over the second quarter 2015, expenditure on durable goods slowed down (+1.0% after +1.9%), notably expenditure on household durables (–0.1% after +1.6%). Car purchases remained dynamic (+2.0% after +2.3%).
Textile-leather: increasing in June, decreasing over the quarter
Consumption of textile, clothing and leather increased in June (+0.4% after –0.1%). However, purchases stepped back over the whole second quarter (–2.0% after +1.6%).
[* Volumes are chained and all figures are trading days and seasonally adjusted.]
graphiquegraph1_new_ang – Total consumption of goods
graphiquegraph2_new_ang – Food and engineered goods

graphiquegraph3_new_ang – Breakdown of engineered goods

Other engineered goods: moderate rise in June
Consumption expenditure on other engineered goods increased slightly in June (+0.2%, after –0.1%), especially in hardware. They were almost flat over the second quarter (–0.1% after +1.4%).
Food products: acceleration in June and over the quarter
In June, consumption of food products bounced back (+0.6% after being stable in May). Over the second quarter, it accelerated (+0.8% after +0.2% over the previous quarter).
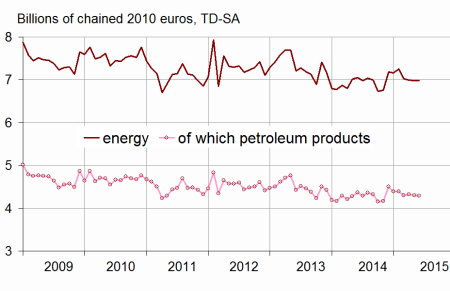
Energy: downturn over the quarter
In June, household consumption of energy products was virtually stable (–0.1%).
Over the second quarter, consumption of energy products stepped back (–2.2% after +3.7%), mainly in gas and electricity.
The variation in May remains unchanged
Since the previous publication, new information has been integrated, and the seasonal adjustment coefficients were updated. However, the variation of households’ consumption of goods remains unchanged in May (+0.1%).
graphiquegraph4_new_ang – Energy
tableauenglish_trim – Household consumption expenditure on goods
| April | May | June | June15/ | Q2 15/ | |
|---|---|---|---|---|---|
| 2015 | 2015 | 2015 | June14 | Q1 15 | |
| Food products | 16.056 | 16.056 | 16.155 | ||
| Change (%) | 0.3 | 0.0 | 0.6 | 1.0 | 0.8 |
| Engineered goods | 20.286 | 20.342 | 20.411 | ||
| Change (%) | 0.1 | 0.3 | 0.3 | 2.6 | 0.0 |
| Durables | 10.071 | 10.137 | 10.177 | ||
| Change (%) | -0.3 | 0.7 | 0.4 | 4.7 | 1.0 |
| - of which automobiles | 4.763 | 4.788 | 4.822 | ||
| Change (%) | 0.4 | 0.5 | 0.7 | 3.7 | 2.0 |
| - of which household durables | 4.098 | 4.097 | 4.112 | ||
| Change (%) | -0.2 | 0.0 | 0.4 | 6.0 | -0.1 |
| Textile-leather | 4.117 | 4.113 | 4.129 | ||
| Change (%) | 1.6 | -0.1 | 0.4 | -1.4 | -2.0 |
| Other engineered goods | 6.102 | 6.097 | 6.110 | ||
| Change (%) | -0.2 | -0.1 | 0.2 | 2.4 | -0.1 |
| Energy | 6.993 | 6.984 | 6.977 | ||
| Change (%) | -0.4 | -0.1 | -0.1 | -1.0 | -2.2 |
| - including petroleum products | 4.329 | 4.298 | 4.286 | ||
| Change (%) | 0.8 | -0.7 | -0.3 | -1.9 | -1.2 |
| Total | 43.299 | 43.342 | 43.501 | ||
| Change (%) | 0.1 | 0.1 | 0.4 | 1.4 | -0.1 |
| Manufactured goods | 37.203 | 37.248 | 37.314 | ||
| Change (%) | 0.4 | 0.1 | 0.2 | 1.7 | 0.3 |
Documentation
Methodology (pdf,23 Ko)
Pour en savoir plus
