


 15 April 2015
2015- n° 84Consumer prices increased by 0.7% in March 2015; they diminished by 0.1% year-on-year Consumer price index - final results - March 2015
15 April 2015
2015- n° 84Consumer prices increased by 0.7% in March 2015; they diminished by 0.1% year-on-year Consumer price index - final results - March 2015
In March 2015, the Consumer Price index (CPI) grew by 0.7%, as in February. Year-on-year, consumer prices diminished by 0.1% after -0.3% in February and -0.4% in January.
Monthly change: +0.7%; Year-on-year: -0.1%
In March 2015, the Consumer Price index (CPI) grew by 0.7%, as in February. Year-on-year, consumer prices diminished by 0.1% after -0.3% in February and -0.4% in January.
As in February 2015, the main contributors to the consumer price rise came from the rebound of manufactured product prices after the end of winter sales and tariffs of some services during the school holiday period. Again, petroleum products and fresh foodstuffs have also contributed to the rising consumer prices.
Manufactured product prices bounced back after winter sales
Due to the effects of the introduction this year of an additional week of sales in February, the rebound in prices of manufactured products was, as a direct consequence, higher in March this year than last year (+2.0% versus +1.3% in March 2014). This was especially the case in prices of clothing and footwear (+12.6% versus +10.2% in March 2014; -0.5% year-on-year), household textiles (+2.1% versus +0.2% last year; +1.0% year-on-year), furniture and furnishings (+1.4% versus +0.9% in March 2014; -0.4% year-on-year) and domestic appliances (+0.8% versus +0.4% last year; -1.9% year-on-year). Moreover, prices of vehicles recovered (+0.2% in March as in February; +1.2% year-on-year). On the other hand, prices of medical products continued to drop (-0.7%; -3.2% year-on-year after -3.0% in February). Year-on-year, prices of manufactured products remained on an downward trend (-1.0%).
tableauOLE_LINK2 – Detailed figures for various groups
| Weights | Index | Percentage changes | ||
|---|---|---|---|---|
| Items | 2015 | March 2015 | m-on-m | y–on–y |
| a) All households - France | ||||
| All items (00 E) | 10000 | 128.12 | 0.7 | -0.1 |
| All items SA (00 C) | 10000 | 127.73 | 0.0 | 0.0 |
| Food (4000 E) | 1662 | 132.34 | 0.2 | 0.1 |
| Fresh food (4001 E) | 211 | 146.26 | 2.3 | 5.1 |
| Food excluding fresh products (4002 E) | 1451 | 130.4 | -0.1 | -0.6 |
| Tobacco (4034 E) | 199 | 259.25 | 0.2 | 0.3 |
| MANUFACTURED PRODUCTS (4003 E) | 2584 | 100.13 | 2.0 | -1.0 |
| Clothing and footwear (4004 E) | 437 | 110.6 | 12.6 | -0.5 |
| Medical products (4005 E) | 427 | 76.61 | -0.7 | -3.2 |
| Other manufactured products (4006 E) | 1720 | 103.68 | 0.3 | -0.7 |
| ENERGY (4007 E) | 815 | 172.33 | 1.0 | -3.7 |
| Petroleum products (4008 E) | 418 | 184.66 | 2.9 | -8.7 |
| SERVICES (4009 E) | 4740 | 137.17 | 0.0 | 1.1 |
| Actual rentals and services for dwellings (4010 E) | 767 | 143.46 | 0.0 | 0.9 |
| Medical services (4011 E) | 568 | 122.68 | -0.2 | 0.5 |
| Transport and communication services (4012 E) | 510 | 96.09 | -0.5 | 0.9 |
| Other services (4013 E) | 2895 | 148.28 | 0.2 | 1.3 |
| ALL ITEMS EXCLUDING RENTALS AND TOBACCO (5000 E) | 9192 | 125.52 | 0.7 | -0.1 |
| ALL ITEMS EXCLUDING TOBACCO (4018 E) | 9801 | 126.2 | 0.7 | -0.1 |
| b) Manual or clerical worker headed urban households - France | ||||
| ALL ITEMS EXCLUDING TOBACCO (4018 D) | 9714 | 125.97 | 0.6 | -0.1 |
| ALL ITEMS (00 D) | 10000 | 128.78 | 0.6 | -0.1 |
| c) Households that belong to the lowest equivalized disposable income quintile - France | ||||
| ALL ITEMS EXCLUDING TOBACCO (4018 Q) | 9687 | 127.17 | 0.6 | -0.1 |
- Source: INSEE - Consumer Price Indexes
tableauTableau1English – Detailed figures for Core inflation* and HICP**
| Weights | Index | Percentage changes | ||
|---|---|---|---|---|
| Items | 2015 | March 2015 | m–on–m | y–on–y |
| All items "Core inflation" (4022 S) | 6042 | 122.82 | 0.1 | 0.2 |
| Food excluding fresh products, meat, milk and exotic products (4019 S) | 715 | 124.76 | -0.1 | -0.8 |
| Manufactured products (4020 S) | 2103 | 104.41 | 0.7 | -0.6 |
| Services including actual rentals and services for dwellings (4021 S) | 3224 | 140.41 | -0.1 | 1.0 |
| All items HICP (00 H) | 115.87 | 0.7 | 0.0 | |
- * ISJ: Core inflation indicator excludes public sector prices, the most volatile consumer prices and the tax measures. Seasonally adjusted, this index is calculated for all households in France excluding overseas departments and territories (base 100 1998).
- **HICP: Harmonised Indices of Consumer Prices are inflation figures designed for international comparison of consumer price inflation between Member states of the European Union. This index is calculated for all households in France (base 100 2005).
- Source: INSEE - Consumer Price Indexes
graphiqueGraphique1English – Consumer price index (IPC) and Core inflation (ISJ) – year-on-year changes
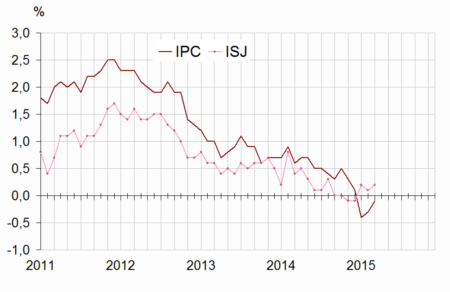
- Source : Insee - Consumer Price Indexes
Energy prices continued to recover
In March 2015, energy prices increased again, (+1.0% after +2.1%) but fell again year-on-year (-3.7% after -5.3% in February). Prices of petroleum products continued to recover: they grew by 2.9% month-on-month (after +4.7% in February; -8.7% year-on-year) in the wake of the rebound in oil prices measured in euros. In March, the increases in fuels for transport (+3.4%; -7.8% year-on-year) were higher than those of heat fuels (+1.5%; -14.7% year-on-year). Furthermore, gas prices decreased again (-3.3% after -1.2% in February; -1.6% year-on-year) while electricity tariffs remained unchanged (+4.3% year-on-year).
Stability in service prices
In March 2015, service prices remained broadly stable; year-on-year, they increased by 1.1% after +1.3% in February. Prices of some services related to winter holidays rose seasonally by +5.8% for accommodation services (-0.7% year-on-year) and by 4.4% for package holidays (-1.9% year-on-year). These increases were almost offset by the seasonal fall of airfares (-2.3%; +0.7% year-on-year).
New increase in food prices
In March 2015, food prices rose again (+0.2% as in February; +0.1% year-on-year), as prices of fresh foodstuffs have continued to increase (+2.3% after +1.3% in February; +5.1% year-on-year). This increase mainly stemmed from the seasonal rise in fresh fruit prices (+5.8% in March; +0.9% year-on-year). Moreover, prices of fresh vegetables were much higher this year (+9.4% year-on-year after +9.1%) because of less favourable weather conditions than last year. Excluding fresh products, prices of the other food products tend to decline (-0.1%; -0.6% year-on-year). With the exception of meat (+0.2%), fish and seafood (+1.1%) and alcoholic beverages (+0.6%) which prices grew slightly year-on-year, prices of other food products were lower in March 2015 compared to March 2014.
Slight increase in core inflation
In March 2015, the core inflation indicator (ISJ) grew by 0.1% (after +0.2% in February). Year-on-year, it grew by 0.2%. The harmonized Index of Consumer Prices (HICP) increased by 0.7% in March and was stable year-on-year (after -0.3% in February).
Pour en savoir plus
