


 23 April 2015
2015- n° 96In April 2015, the business climate is almost stable in services Monthly survey of services - April 2015
23 April 2015
2015- n° 96In April 2015, the business climate is almost stable in services Monthly survey of services - April 2015
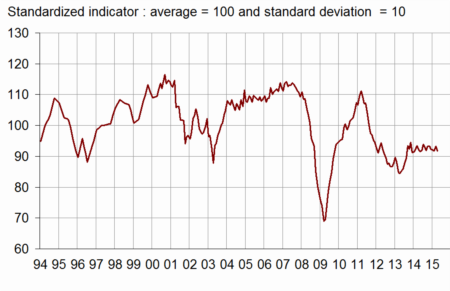
According to business managers, the economic situation in services is almost stable in April 2015. The business climate composite indicator decreases by one point and stands at 92, still below its long-term average. The turning point indicator still indicates an unfavorable dynamic.

Warning: From now on, the turning point indicator is computed with a new method (cf. methodology).
All services
According to business managers, the economic situation in services is almost stable in April 2015. The business climate composite indicator decreases by one point and stands at 92, still below its long-term average. The turning point indicator still indicates an unfavorable dynamic.
The balance on the general outlook, which relates the assessment of business leaders over their whole sector, has recovered slightly but remains below its long-term average.
More business managers than in March report that their activity has improved over the last few months. Nevertheless, their anticipations on activity for the coming months have deteriorated. The corresponding balances remain below their long-term average. The anticipations on demand are steady, below their long-term average.
The balance of opinion on the past operating balance result is stable since January, whereas the balance on the expected operating balance result has decreased. Both of the balances remain below their long-term level.
In service sectors except temporary employment agencies, the balance of opinion on past employment is stable and the balance on expected employment has recovered moderately. Both of the balances are below their long-term average.
graphiqueGraph1 – Composite indicator
graphiquegraph_retourn – Turning point indicator
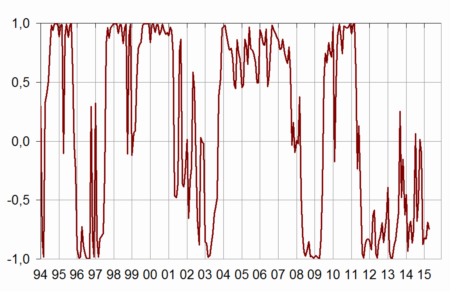
- Note: close to 1 (respectively -1), this indicator indicates a favorable short-term economic situation (respectively unfavorable).
tableauTable_quarter – Economic outlook in the services sector
| Average* | Jan. 15 | Feb. 15 | March 15 | April 15 | |
|---|---|---|---|---|---|
| Composite indicator | 100 | 92 | 92 | 93 | 92 |
| General outlook | –8 | –17 | –17 | –16 | –14 |
| Past activity | 2 | –9 | –10 | –13 | –10 |
| Expected activity | 2 | –6 | –7 | –5 | –10 |
| Expected demand | –1 | –8 | –8 | –6 | –6 |
| Business situation | –3 | –11 | –9 | –9 | –10 |
| Past selling prices | –4 | –10 | –12 | –12 | –14 |
| Expected selling prices | –2 | –13 | –9 | –10 | –7 |
| Past employment | 2 | –6 | –2 | –9 | –9 |
| except temporary work agencies | 1 | –5 | –1 | –7 | –7 |
| Expected employment | 2 | –6 | –2 | –4 | –5 |
| except temporary work agencies | –1 | –8 | –5 | –9 | –7 |
| Investments | |||||
| Past investments | 1 | –4 | –4 | 0 | 4 |
| Expected investments | 1 | 0 | 0 | –2 | 0 |
| Operating balance result | |||||
| Past result | –2 | –10 | –10 | ||
| Expected result | –2 | –8 | –11 | ||
| Cash position | –11 | –15 | –15 | ||
| Difficulties of supply and demand | |||||
| difficulties of supply and demand | 10 | 14 | 13 | ||
| difficulties of supply only | 22 | 19 | 19 | ||
| difficulties of demand only | 32 | 40 | 38 | ||
| Difficulties in recruitment | 28 | 17 | 18 |
- * Average of the balances of opinion since 1988
- Source: Insee
Road transport
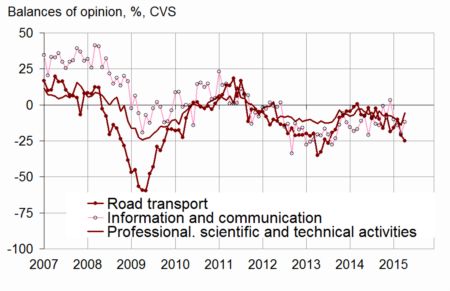
In road freight and mail activities, business leaders’ judgement on past and expected activity remains deteriorated. Nevertheless, the balances on expected demand and employment have improved and come closer to their long-term level.
Accommodation and food service activities
In accommodation and food service activities, more business managers than in March expect their activity and the demand to decline in the coming months. However, the balances on employment have increased significantly ; the balance on past employment stands above its long-term average.
Information and communication
In information and communication, the balance of opinion on past activity has recovered after several months of decline. However, the balance on expected activity has fallen. Business leaders’ expectations of demand are stable. All the balances are below their long-term level.
Real estate
In real estate activities, business leaders’ anticipations of activity and demand are roughly stable. The balance of opinion on expected employment has dropped and stands below its long-term average.
Professional, scientific and technical activities
In professional, scientific and technical activities, the balance on past activity has improved. Nevertheless, business leaders’ anticipations of activity and demand have deteriorated.
Administrative and support service activities
In administrative and support service activities, the balances of opinion on past and expected activity and employment have gone down. The anticipations of demand are almost steady. All the balances are below their long-term level.
graphiquegraph_bonus_ – Past activity
tableauTable_det – Detailed data
| A21 | Average* | Jan. 15 | Feb. 15 | March 15 | April 15 |
|---|---|---|---|---|---|
| (H) Road transport | |||||
| Past activity | –8 | –16 | –10 | –21 | –25 |
| Expected activity | –10 | –20 | –24 | –20 | –19 |
| Expected demand | –13 | –23 | –24 | –24 | –14 |
| Past employment | –8 | –5 | –4 | –9 | –10 |
| Expected employment | –11 | –15 | –14 | –18 | –10 |
| (I) Accommodation and food service activities | |||||
| Past activity | –7 | –14 | –17 | –26 | –22 |
| Expected activity | –7 | –9 | –10 | –14 | –17 |
| Expected demand | –9 | –8 | –1 | –2 | –10 |
| Past employment | –4 | –8 | –9 | –20 | –7 |
| Expected employment | –6 | –13 | –18 | –13 | 1 |
| (J) Information and communication | |||||
| Past activity | 9 | –10 | –14 | –20 | –12 |
| Expected activity | 10 | –5 | –6 | 3 | –13 |
| Expected demand | 11 | 4 | 5 | 4 | 5 |
| Past employment | 6 | 2 | –2 | –3 | –7 |
| Expected employment | 11 | –5 | 1 | 0 | 2 |
| (L) Real estate activities | |||||
| Past activity | 7 | 7 | 0 | 4 | 0 |
| Expected activity | 7 | 3 | 1 | 12 | 10 |
| Expected demand | 1 | –4 | –4 | –4 | –3 |
| Past employment | 3 | –1 | 3 | –2 | 1 |
| Expected employment | 2 | 6 | 4 | 9 | –2 |
| (M) Professional, scientific and technical activities | |||||
| Past activity | –1 | –9 | –11 | –14 | –6 |
| Expected activity | –2 | –12 | –11 | –11 | –14 |
| Expected demand | –6 | –14 | –20 | –16 | –19 |
| Past employment | 1 | 0 | 2 | –5 | 0 |
| Expected employment | 0 | –1 | 1 | –6 | –8 |
| (N) Administrative and support service activities | |||||
| Past activity | 6 | –11 | –7 | –1 | –4 |
| Expected activity | 5 | –4 | –3 | 2 | –5 |
| Expected demand | 3 | –7 | –10 | –3 | –2 |
| Past employment | 8 | –8 | 0 | –8 | –11 |
| Expected employment | 6 | –3 | 1 | 7 | –1 |
- * Average of the balances of opinion since 1988 (2006 for road transport)
Documentation
Methodology (2016) (pdf,158 Ko)
Pour en savoir plus
Time series : Economic outlook surveys – Services
