


 28 May 2015
2015- n° 126Prices of second-hand dwellings stopped decreasing in Q1 2015, but were still declining
year-on-year (–1.9%) Indexes of prices of second-hand dwellings - 1st quarter 2015
28 May 2015
2015- n° 126Prices of second-hand dwellings stopped decreasing in Q1 2015, but were still declining
year-on-year (–1.9%) Indexes of prices of second-hand dwellings - 1st quarter 2015
During the first quarter of 2015, prices of second-hand dwellings went slightly up (+0.3% quarter-on-quarter according to provisional results after -1.3% in Q4 2014, s.a. data). This rise concerned only houses: +0.6%, after –1.6% during Q4 2014. Prices of flats were still slightly decreasing (–0.2%, after –0.8%).
During the first quarter of 2015, prices of second-hand dwellings went slightly up (+0.3% quarter-on-quarter according to provisional results after -1.3% in Q4 2014, s.a. data). This rise concerned only houses: +0.6%, after –1.6% during Q4 2014. Prices of flats were still slightly decreasing (–0.2%, after –0.8%).
Year-on-year, prices of second-hand dwellings continued however their downward trend around 2% observed since the end of 2012: –1.9% in Q1 2015 compared to Q1 2014, against –2.5% in Q4 2014. This decrease is more important for flats (–2.5% y-o-y) than for houses (–1.5%).
Prices were still declining in Île-de-France
In Île-de-France, prices of second-hand dwellings went on declining during the first quarter of 2015, almost at the same pace as the last 2 years (–0.4% q-o-q, –2.1% y-o-y).
Slight raise in provincial France
In provincial France, prices of second-hand dwellings increased sligthly (+0.6% q-o-q, after –1.5% in Q4 2014). This increase concerned houses (+0.7%) and flats (+0.4%).
However, year-on-year, prices were still decreasing: –1.8%. This decline is more important for flats (–2.4%) than for houses (–1.5%).
graphiqueGraphique1a – Prices of second-hand dwellings
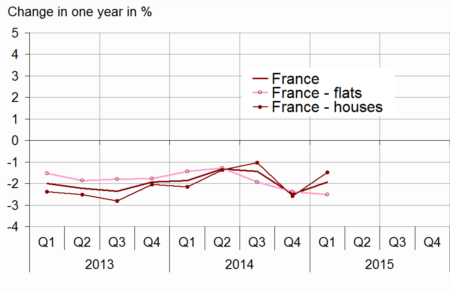
- Sources: INSEE, French notaries - Database Bien, Perval society
graphiqueGraphique2a – Prices of second-hand dwellings in Île-de-France

- Sources: INSEE, French notaries - Database Bien, Perval society
tableauTableau1a – Variation in prices of second-hand dwellings in metropolitan France
| change in | ||||||
|---|---|---|---|---|---|---|
| 3 months (S.A.) | 12 months | |||||
| 2014 Q3 | 2014 Q4 (sd) | 2015 Q1 (p) | 2014 Q3 | 2014 Q4 (sd) | 2015 Q1 (p) | |
| France | -0.8 | -1.3 | 0.3 | -1.4 | -2.5 | -1.9 |
| Flats | -1.1 | -0.8 | -0.2 | -1.9 | -2.4 | -2.5 |
| Houses | -0.5 | -1.6 | 0.6 | -1.0 | -2.6 | -1.5 |
- (p): provisional
- (sd): semi-definitive
- Sources: INSEE, French notaries - Database Bien, Perval society
The annual volume of transactions was stable in the first quarter of 2015
The annual volume of transactions was stable in the first quarter of 2015, after decreasing since june 2014. In March, it was estimated at 698,000 over the last 12 months, against 691,000 in December 2014.
Year-on-year, the annual number of transactions decreased: –4.6%, against the 732,000 transactions completed from April 2013 to March 2014.
graphiqueGraphique3a – Volume of transactions of second-hand dwellings over the last 12 months
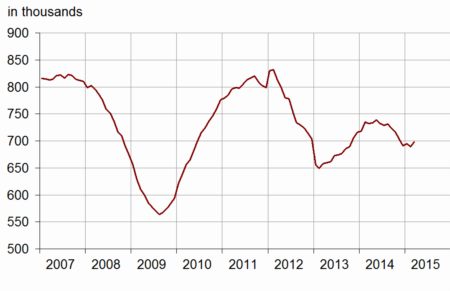
- CGEDD, based on notarial databases and DGFiP (MEDOC)
Revisions
The index is revised to include transactions recorded after the last publication.
In comparison to the results released on 7th April 2015, the change in prices in the fourth quarter of 2014 was revised downwards by 0.1 points for the total (+0.1 for flats, –0.2 for houses).
tableauTableau2a – Variation in prices of second-hand dwellings in metropolitan France
| Change in | ||||||
|---|---|---|---|---|---|---|
| 3 months (S.A.) | 12 months | |||||
| 2014 Q3 | 2014 Q4 (sd) | 2015 Q1 (p) | 2014 Q3 | 2014 Q4 (sd) | 2015 Q1 (p) | |
| Metropolitan France | -0.8 | -1.3 | 0.3 | -1.4 | -2.5 | -1.9 |
| - Flats | -1.1 | -0.8 | -0.2 | -1.9 | -2.4 | -2.5 |
| - Houses | -0.5 | -1.6 | 0.6 | -1.0 | -2.6 | -1.5 |
| Île-de-France | -0.6 | -0.7 | -0.4 | -1.9 | -2.1 | -2.1 |
| Provincial France | -0.9 | -1.5 | 0.6 | -1.2 | -2.7 | -1.8 |
| Flats | ||||||
| Île-de-France | -1.1 | -0.2 | -0.7 | -2.0 | -1.7 | -2.6 |
| - Paris | -1.6 | -0.4 | -0.7 | -2.1 | -2.3 | -2.9 |
| - Seine-et-Marne | 0.6 | -1.6 | -0.9 | -2.9 | -3.1 | -2.9 |
| - Yvelines | -1.1 | 0.3 | -2.0 | -2.6 | -0.9 | -3.0 |
| - Essonne | -1.1 | -1.6 | 0.1 | -3.3 | -3.5 | -3.2 |
| - Hauts-de-Seine | -0.9 | 0.7 | -1.0 | -1.4 | -0.3 | -2.1 |
| - Seine-Saint-Denis | -0.7 | 0.3 | 0.1 | -1.5 | -0.7 | -1.7 |
| - Val-de-Marne | -0.7 | -0.2 | -0.2 | -1.2 | -1.3 | -1.9 |
| - Val-d'Oise | -0.6 | -1.7 | -0.1 | -2.6 | -3.3 | -2.7 |
| Provincial France | -1.1 | -1.4 | 0.4 | -1.9 | -3.0 | -2.4 |
| - Conurbation > 10,000 inhabitants | -1.1 | -1.3 | ** | -2.0 | -3.1 | ** |
| - Central town | -1.0 | -1.6 | ** | -1.6 | -3.1 | ** |
| - Suburb | -1.2 | -0.8 | ** | -2.7 | -3.0 | ** |
| - Conurbation < 10,000 inhabitants | -1.1 | -1.9 | ** | -0.4 | -2.0 | ** |
| Houses | ||||||
| Île-de-France | 0.4 | -1.6 | 0.3 | -1.6 | -2.9 | -1.3 |
| - Seine-et-Marne | 0.5 | -2.0 | 1.1 | -2.1 | -3.7 | -0.8 |
| - Yvelines | 0.5 | -1.4 | 0.3 | -1.3 | -2.9 | -0.7 |
| - Essonne | 0.1 | -1.7 | 1.1 | -2.1 | -3.5 | -0.7 |
| - Hauts-de-Seine | 1.7 | -1.0 | -2.1 | 0.9 | -0.8 | -2.1 |
| - Seine-Saint-Denis | -0.5 | -2.3 | 1.8 | -2.7 | -3.6 | -2.3 |
| - Val-de-Marne | 0.2 | -1.3 | 0.0 | -1.7 | -2.6 | -2.1 |
| - Val-d'Oise | 0.3 | -1.3 | 0.0 | -2.3 | -3.1 | -1.9 |
| Provincial France | -0.8 | -1.6 | 0.7 | -0.9 | -2.5 | -1.5 |
| Nord-Pas de Calais | -0.9 | -1.9 | ** | -2.1 | -4.3 | ** |
| - Flats | -3.6 | -1.6 | ** | -4.4 | -7.0 | ** |
| - Houses | -0.3 | -2.0 | ** | -1.6 | -3.8 | ** |
| - Lille Houses | -0.4 | -2.3 | ** | -0.4 | -3.1 | ** |
| Provence-Alpes-Côte d'Azur | -1.1 | -1.7 | ** | -2.1 | -3.7 | ** |
| - Flats | -0.8 | -1.0 | ** | -2.2 | -3.1 | ** |
| - Houses | -1.4 | -2.4 | ** | -1.9 | -4.4 | ** |
| - Marseille Flats | -2.7 | 1.3 | ** | -5.6 | -3.1 | ** |
| Rhône-Alpes | -1.2 | -0.8 | ** | -0.8 | -1.7 | ** |
| - Flats | -1.1 | -0.9 | ** | -1.3 | -1.9 | ** |
| - Houses | -1.3 | -0.6 | ** | -0.4 | -1.4 | ** |
| - Lyon Flats | -0.8 | -0.4 | ** | 0.4 | -1.4 | ** |
- ** index released on the 7th July 2014
- (p): provisional
- (sd): semi-definitive
- Sources: INSEE, French notaries - Database Bien, Perval society
Pour en savoir plus
