


 11 September 2014
2014- n° 207In the second quarter 2014, prices of second-hand dwellings were stable, but kept
on decreasing year-on-year (-1.2 %) Indexes of prices of second-hand dwellings - 2nd Quarter 2014
11 September 2014
2014- n° 207In the second quarter 2014, prices of second-hand dwellings were stable, but kept
on decreasing year-on-year (-1.2 %) Indexes of prices of second-hand dwellings - 2nd Quarter 2014
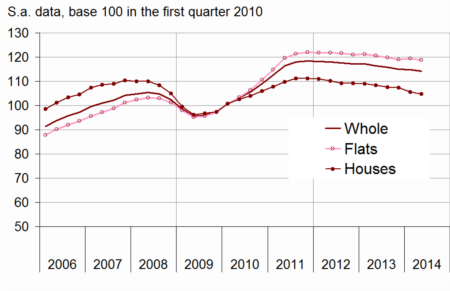
Prices of second-hand dwellings were stable in the second quarter 2014 according to provisional results (s.a. data). This stability combined different changes : –0.3% for flats and +0.2 % for houses.
Prices of second-hand dwellings were stable in the second quarter 2014 according to provisional results (s.a. data). This stability combined different changes : –0.3% for flats and +0.2 % for houses.
Year-on-year, prices decreased : -1.2%, after -1,9% in the first quarter. This decrease concerned flats (-1.1 %) as well as houses (–1.3 %).
In Île-de-France, prices went down by 0.5 % in the second quarter 2014
In Île-de-France, in the second quarter 2014, prices of second-hand dwellings decreased by 0.5 % (provisional results, s.a. data).
Year-on-year, prices in Île-de-France shrank by 2.0 %. It was more significant for houses (–3.3 %) than for flats (–1.4 %).
In provincial France, prices went up slightly in the second quarter 2014
In provincial France, prices went up slightly (+0.2 %, provisional results s.a. data) in the second quarter 2014. This raise was due to the prices of houses (+0.4 %). By contrast, the prices of flats were still slightly decreasing (–0.2 %).
Year-on-year, prices of second-hand dwellings in provincial France decreased, but not as much as in Île–de-France (-0.8 %, after -1,8% in the first quarter). This decline is the same for houses (-0.8 %) and for flats (-0.7 %).
graphiqueGraphique1a – Prices of second-hand dwellings
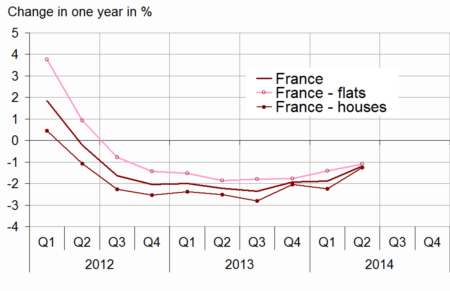
- Insee, French notaries - Database Bien, Perval society
graphiqueGraphique2a – Prices of second-hand dwellings in Île-de-France
- Insee, French notaries - Database Bien, Perval society
tableauTableau1a – Prices of second-hand dwellings indexes
| change in | ||||||
|---|---|---|---|---|---|---|
| 3 months (S.A.) | 12 months | |||||
| 2013 Q4 | 2014 Q1 (sd) | 2014 Q2 (p) | 2013 Q4 | 2014 Q1 (sd) | 2014 Q2 (p) | |
| France | –0,2 | –0,3 | 0,0 | –1,9 | –1,9 | –1,2 |
| Flats | –0,4 | 0,1 | –0,3 | –1,8 | –1,4 | –1,1 |
| Houses | 0,0 | –0,6 | 0,2 | –2,0 | –2,3 | –1,3 |
- (p) : provisional
- (sd) : semi-definitive
- Sources : Insee, French notaries - Database Bien, Perval society
The annual volume of transactions is stable in the second quarter 2014
In June 2014, the annual volumes of transactions were stable, after increasing since the beginning of 2013. The number of transactions was estimated at 735 000 over the last 12 months.
Year-on-year, the annual number of transactions rose significantly (+9.2 % against the transactions completed from July 2012 to June 2013).
graphiqueGraphique3a – Volume of transactions of second-hand dwellings over the last 12 months
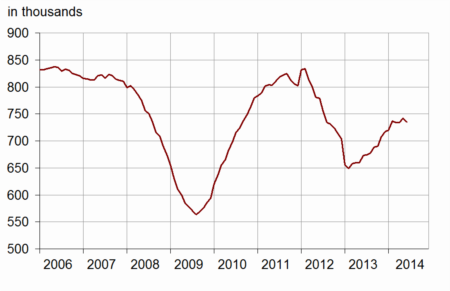
- CGEDD-Meeddm based on notarial databases and DGFiP
Revisions
The index is revised to include transactions recorded after the last publication. Furthermore, for this publication, the seasonal factors for provincial France were revised. This could marginally change the figures since the beginning of 2008. In comparison to the results released on 4th July, the change in prices in the first quarter 2014 was revised downwards (-0.3 point) : –0.4 for houses, –0.1 for flats.
In Île-de-France, the change in prices in the first quarter 2014 was revised downwards (–0.5, –0.8 for houses, –0.3 for flats,). In provincial France, it was also revised downwards (–0.2, –0.2 for houses, +0.1 for flats).
tableauTableau2a – Evolution of prices of second-hand dwellings in France
| Change in | ||||||
|---|---|---|---|---|---|---|
| 3 months (S.A.) | 12 months | |||||
| 2013 Q4 | 2014 Q1 (sd) | 2014 Q2 (p) | 2013 Q4 | 2014 Q1 (sd) | 2014 Q2 (p) | |
| France métropolitaine | –0,2 | –0,3 | 0,0 | –1,9 | –1,9 | –1,2 |
| - Flats | –0,4 | 0,1 | –0,3 | –1,8 | –1,4 | –1,1 |
| - Houses | 0,0 | –0,6 | 0,2 | –2,0 | –2,3 | –1,3 |
| Île-de-France | –0,5 | –0,3 | –0,5 | –1,8 | –2,1 | –2,0 |
| Province | –0,1 | –0,3 | 0,2 | –2,0 | –1,8 | –0,8 |
| Flats | ||||||
| Île-de-France | –0,7 | 0,4 | –0,5 | –1,8 | –1,5 | –1,4 |
| - Paris | –0,4 | 0,4 | –0,7 | –1,5 | –1,8 | –1,1 |
| - Seine-et-Marne | –1,4 | –1,7 | –0,4 | –1,8 | –2,1 | –2,9 |
| - Yvelines | –1,6 | 0,2 | –0,2 | –3,2 | –2,5 | –2,1 |
| - Essonne | –1,7 | –0,7 | 0,0 | –2,8 | –2,1 | –2,7 |
| - Hauts-de-Seine | –0,6 | 1,1 | –0,4 | –1,7 | –0,9 | –1,2 |
| - Seine-Saint-Denis | –0,5 | 0,8 | –0,4 | –1,5 | –0,2 | –1,4 |
| - Val-de-Marne | –0,2 | 0,5 | –0,1 | –1,3 | –0,6 | –1,2 |
| - Val-d'Oise | –1,5 | –0,9 | 0,2 | –2,3 | –2,5 | –2,6 |
| Province | –0,2 | –0,1 | –0,2 | –1,8 | –1,2 | –0,7 |
| - Agglomérations > 10 000 hab | –0,2 | –0,3 | ** | –1,8 | –1,4 | ** |
| - Villes-centres | 0,0 | 0,0 | ** | –1,8 | –1,0 | ** |
| - Banlieues | –0,5 | –0,7 | ** | –1,8 | –2,0 | ** |
| - Agglomérations < 10 000 hab | –0,2 | 1,2 | ** | –1,8 | 0,4 | ** |
| Houses | ||||||
| Île-de-France | –0,3 | –1,7 | –0,6 | –1,8 | –3,2 | –3,3 |
| - Seine-et-Marne | –0,2 | –2,4 | –0,1 | –1,8 | –3,4 | –2,8 |
| - Yvelines | 0,3 | –2,5 | –0,1 | –1,2 | –3,5 | –3,0 |
| - Essonne | –0,3 | –2,2 | 0,1 | –1,9 | –3,4 | –2,7 |
| - Hauts-de-Seine | 0,0 | –1,7 | –2,2 | –0,7 | –2,9 | –4,8 |
| - Seine-Saint-Denis | –1,4 | 0,6 | –1,1 | –3,4 | –2,6 | –3,4 |
| - Val-de-Marne | –0,5 | –0,9 | –1,3 | –2,1 | –2,8 | –3,7 |
| - Val-d'Oise | –0,6 | –1,4 | –0,8 | –1,9 | –3,0 | –3,2 |
| Province | 0,0 | –0,3 | 0,4 | –2,1 | –2,0 | –0,8 |
| Nord-Pas de Calais | 0,3 | –0,6 | ** | –1,0 | –1,4 | ** |
| - Flats | 1,0 | –1,2 | ** | –0,5 | –2,2 | ** |
| - Houses | 0,2 | –0,5 | ** | –1,1 | –1,2 | ** |
| - Lille Houses | 0,4 | –0,2 | ** | –0,2 | –0,1 | ** |
| Provence-Alpes-Côte d'Azur | 0,1 | –1,0 | ** | –2,2 | –2,3 | ** |
| - Flats | 0,0 | –1,0 | ** | –2,2 | –2,3 | ** |
| - Houses | 0,1 | –0,9 | ** | –2,1 | –2,2 | ** |
| - Marseille Flats | –1,3 | 0,1 | ** | –4,7 | –3,7 | ** |
| Rhône-Alpes | 0,1 | 0,5 | ** | –0,7 | –0,4 | ** |
| - Flats | –0,3 | 0,6 | ** | –1,0 | 0,0 | ** |
| - Houses | 0,4 | 0,4 | ** | –0,4 | –0,8 | ** |
| - Lyon Flats | 1,6 | 0,5 | ** | –0,2 | 1,4 | ** |
- ** indice released on the 7th October 2014
- (p) : provisional
- (sd) : semi-definitive
- Sources : Insee, French notaries - Database Bien, Perval society
Pour en savoir plus
