


Quarterly national accounts in Q3 2014 National accounts in base 2010 - Detailed results
In Q3 2014, GPD increased by 0.3% and households’ purchasing power improved by 0.5% Quarterly national accounts - detailed figures - 3rd Quarter 2014
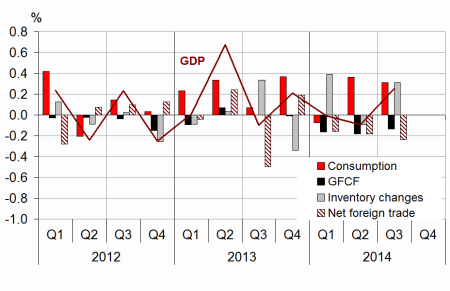
In Q3 2014, French gross domestic product (GDP) in volume terms* increased by 0.3% after a slight decline in Q2 (–0.1%).
In Q3 2014, French gross domestic product (GDP) in volume terms* increased by 0.3% after a slight decline in Q2 (–0.1%).
Households’ consumption expenditure kept increasing (+0.3% after +0.5%). General government expenditure increased by +0.6% (after +0.4%). Total gross fixed capital formation (GFCF) went down again (–0.6% after –0.8%). Thus, final domestic demand (excluding changes in inventories) improved: it contributed for +0.2 points to GDP growth, as in Q2. Imports sped up (+1.3% after +0.6%) and exports recovered (+0.5% after 0.0%). Foreign trade balance contribution was negative: –0.2 points, as in the previous quarter. Conversely, changes in inventories contributed positively (+0.3 points after –0.1 points).
Households’ purchasing power increased by 0.5%
In Q3 2014, wages earned by households decelerated slightly (+0.2% after +0.4%); the average wage per capita paid by non-financial corporations (NFC) increased by 0.3%, as in Q2, but employement decreased (–0.1% after 0.0%). Social benefits accelerated (+1.0% after +0.4%), notably pensions. Taxes on income and wealth were almost steady (+0.1% after –0.3%). Finally, households’ gross disposable income (GDI) continued to rise: +0.5%, as in Q2.

* This growth rate is seasonally and working-day adjusted; volumes are chain-linked previous-year-prices volumes
graphiqueGraph1 – GDP and its main components
tableauTab1 – Goods and services:supply and uses chain-linked volumes
| 2013 Q4 | 2014 Q1 | 2014 Q2 | 2014 Q3 | 2013 | 2014 (ovhg) | |
|---|---|---|---|---|---|---|
| GDP | 0.2 | 0.0 | -0.1 | 0.3 | 0.4 | 0.3 |
| Imports | 0.2 | 1.1 | 0.6 | 1.3 | 1.9 | 3.3 |
| Household consumption *expenditure | 0.4 | -0.3 | 0.5 | 0.3 | 0.3 | 0.5 |
| General government's *consumption expenditure | 0.5 | 0.4 | 0.4 | 0.6 | 2.0 | 1.8 |
| GFCF | 0.0 | -0.7 | -0.8 | -0.6 | -0.8 | -1.6 |
| *of which Non-financial corporated and unincorporated enterprises | 0.7 | -0.6 | -0.5 | 0.0 | -0.6 | -0.2 |
| Households | -1.9 | -1.9 | -1.9 | -1.7 | -3.1 | -6.1 |
| General government | -0.1 | 0.2 | -0.7 | -1.3 | 1.1 | -0.5 |
| Exports | 0.9 | 0.6 | 0.0 | 0.5 | 2.4 | 1.9 |
| Contributions : | ||||||
| Internal demand excluding inventory changes | 0.4 | -0.2 | 0.2 | 0.2 | 0.4 | 0.4 |
| Inventory changes | -0.3 | 0.4 | -0.1 | 0.3 | -0.2 | 0.4 |
| Net foreign trade | 0.2 | -0.2 | -0.2 | -0.2 | 0.1 | -0.5 |
tableauTab2 – Sectoral accounts
| 2013 Q4 | 2014 Q1 | 2014 Q2 | 2014 Q3 | 2013 | 2014 (ovhg) | |
|---|---|---|---|---|---|---|
| Profit ratio of NFC* (level) | 29.4 | 29.9 | 29.4 | 29.5 | 29.8 | |
| Household purchasing power | -0.2 | 0.8 | 0.5 | 0.5 | 0.0 | 1.3 |
- *NFC: non-financial corporations
tableauTab3 – Production, consumption and GFCF: main components
| 2013 Q4 | 2014 Q1 | 2014 Q2 | 2014 Q3 | 2013 | 2014 (ovhg) | |
|---|---|---|---|---|---|---|
| Production of branches | 0.3 | 0.1 | -0.1 | 0.5 | 0.5 | 0.6 |
| Goods | 0.0 | 0.3 | -0.4 | 0.7 | -0.2 | 0.0 |
| Manufactured ind. | 0.2 | 0.7 | -0.8 | 0.5 | -0.6 | 0.2 |
| Construction | -0.2 | -1.3 | -1.4 | -1.0 | -1.2 | -2.9 |
| Market services | 0.4 | 0.2 | 0.1 | 0.5 | 0.9 | 1.1 |
| Non-market services | 0.4 | 0.4 | 0.3 | 0.5 | 1.5 | 1.5 |
| Household consumption | 0.4 | -0.3 | 0.5 | 0.3 | 0.3 | 0.5 |
| Food products | 0.9 | -1.0 | 0.9 | -0.3 | 0.1 | 0.2 |
| Energy | -1.3 | -4.2 | 2.2 | 1.2 | 0.8 | -4.5 |
| Engineered goods | 1.2 | 0.1 | -0.2 | 0.3 | -1.0 | 1.4 |
| Services | 0.1 | 0.2 | 0.2 | 0.2 | 0.6 | 0.6 |
| GFCF | 0.0 | -0.7 | -0.8 | -0.6 | -0.8 | -1.6 |
| Manufactured goods | 0.6 | -0.1 | -0.5 | 0.0 | -0.9 | 0.4 |
| Construction | -0.6 | -1.4 | -1.7 | -1.5 | -1.6 | -3.9 |
| Market services | 0.3 | -0.1 | 0.2 | 0.3 | 0.3 | 0.4 |
tableauTab4 – Households’ disposable income and ratios of households’ account
| 2013 Q4 | 2014 Q1 | 2014 Q2 | 2014 Q3 | 2013 | 2014 (ovhg) | |
|---|---|---|---|---|---|---|
| HDI | -0.1 | 1.2 | 0.5 | 0.5 | 0.6 | 1.8 |
| Household purchasing power | -0.2 | 0.8 | 0.5 | 0.5 | 0.0 | 1.3 |
| HDI by cu* (purchasing power) | -0.3 | 0.6 | 0.4 | 0.4 | -0.6 | 0.7 |
| Adjusted HDI (purchasing power) | 0.0 | 0.7 | 0.5 | 0.6 | 0.5 | 1.4 |
| Saving rate (level) | 14.6 | 15.5 | 15.6 | 15.8 | 15.1 | |
| Financial saving rate (level) | 5.5 | 6.6 | 6.8 | 7.1 | 5.8 |
- *cu: consumption unit
tableauTab5 – Ratios of non-financial corporations’ account
| 2013 Q4 | 2014 Q1 | 2014 Q2 | 2014 Q3 | 2012 | |
|---|---|---|---|---|---|
| Profit share | 29.4 | 29.9 | 29.4 | 29.5 | 29.8 |
| Investment ratio | 22.7 | 22.5 | 22.5 | 22.5 | 22.6 |
| Savings ratio | 17.1 | 17.1 | 17.1 | 17.2 | 17.1 |
| Self-financing ratio | 75.2 | 75.7 | 76.1 | 76.4 | 75.8 |
tableauTab6 – Expenditure, receipts and net borrowing of public administrations
| 2013 Q4 | 2014 Q1 | 2014 Q2 | 2014 Q3 | 2013 | |
|---|---|---|---|---|---|
| In billions of euros | |||||
| Total expenditure | 305.3 | 307.7 | 308.7 | 310.9 | 1207.7 |
| Total receipts | 283.7 | 285.7 | 284.6 | 286.2 | 1120.4 |
| Net lending (+) or borrowing (-) | -21.6 | -22.0 | -24.1 | -24.6 | -87.2 |
| In % of GDP | |||||
| Net lending (+) or borrowing (-) | -4.1 | -4.1 | -4.5 | -4.6 | -4.1 |
Consumption prices declined slightly in Q3 (–0.1% after 0.0%). Households’ purchasing power rose at the same pace in Q3 and Q2 (+0.5%). Households’ purchasing power, measured per consumption unit, increased also at the same rate as in Q2 (+0.4%).
As household consumption in volume rose less than purchasing power, the saving ratio increased: it went from 15.6% to 15.8% in the 3rd quarter.
Non-financial corporations’ profit ratio improved slightly and reached 29.5%
Non-financial corporations’ added value recovered in Q3 (+0.5% in value after –0.4%) and the wages they pay (including social contributions) slowed down slightly (+0.2% after +0.3%). Thus, NFCs’ profit ratio increased by 0.1 points, from 29.4% to 29.5%.
In Q3 2014, general government deficit stood at 4.6% of GDP
In Q3 2014, general government net borrowing rose slightly from 4.5% to 4.6% of GDP. Expenditures rose by +0.7% (or +2.1 billions of euros), due to the growth of social benefits and social tranfers in kind. Over the same period, receipts picked up (+0.6%, i.e. +1.6 billions of euros, after –0.4%) due mainly to the rebound in corporation tax.
Reviews
The growth rate of GDP is unchanged compared to the previous release («First results» published on November 14, 2014). In details, some components have been reviewed slightly, but these revisions offset each other globally. It results from the integration of statistical indexes known since the previous release or review of indexes over the past quarters.
General government expenditure dynamism in Q3 is softened slightly by taking into account the announcement of a renogociation down of the price of a new treatment against hepatitis C, with retroactive effect.
Avertissement
Quarterly national accounts
Quarterly debt of the general government
Sources
Quarterly national accounts
Quarterly accounts are a consistent set of indicators which provides a global overview of recent economic activity.
Time series of the main aggregates of quarterly national accounts can be accessed through the "Summary". They are classified into eight categories:
- Gross domestic product (GDP) and main economic aggregates ;
- Goods and services ;
- Households' consumption ;
- Foreign trade ;
- Activities ;
- Institutional sectors ;
- Households' income and purchasing power ;
- Public finances.
For each category, are available :
- synthetic files displaying from the accounts the relevant information for economic analysis ,
- sometimes, one or two files displaying all the data available.
Documentation
Abbreviated methodology (pdf, 140 Ko )
Methodology - First estimate at 30 days (pdf, 112 Ko )