


 27 August 2014
2014- n° 194In August 2014, the business climate in services is unchanged Monthly survey of services - August 2014
27 August 2014
2014- n° 194In August 2014, the business climate in services is unchanged Monthly survey of services - August 2014
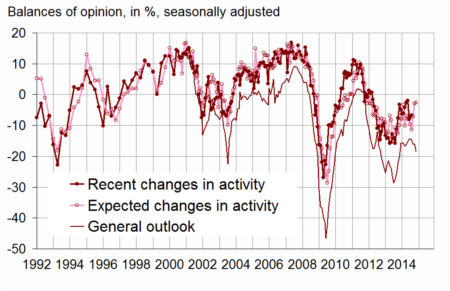
According to business managers, the economic situation in services has remained almost stable in August 2014. The business climate composite indicator has dropped by one point and stands at 93, still below its long-term average (100). The turning point indicator still indicates a favorable dynamic.
All services sector
According to business managers, the economic situation in services has remained almost stable in August 2014. The business climate composite indicator has dropped by one point and stands at 93, still below its long-term average (100). The turning point indicator still indicates a favorable dynamic.
The balance on the general outlook, which relates the assessment of business leaders over their whole sector, has lost two points. It remains below its long-term average.
Business managers consider that activity has remained deteriorated in the recent period. After an improvement in July, business managers’ expectations of activity are stable in August, still below their long-term average.
The balances of opinion on past and expected employment lie just below their long-term averages.
tableauTable_quarter – Economic outlook in the services sector
| Average* | May 14 | June 14 | July 14 | Aug. 14 | |
|---|---|---|---|---|---|
| Composite indicator | 100 | 91 | 92 | 94 | 93 |
| General outlook | –8 | –15 | –16 | –16 | –18 |
| Past activity | 2 | –2 | –8 | –7 | –7 |
| Expected activity | 2 | –11 | –7 | –3 | –3 |
| Expected demand | 0 | –9 | –9 | –7 | –8 |
| Business situation | –3 | –5 | –9 | –13 | –11 |
| Past selling prices | –3 | –12 | –10 | –8 | –9 |
| Expected selling prices | –2 | –10 | –9 | –10 | –9 |
| Past employment | 3 | 2 | 0 | 1 | 2 |
| except temporary work agencies | 1 | –4 | –3 | –1 | –2 |
| Expected employment | 2 | –3 | –2 | –3 | –1 |
| except temporary work agencies | –1 | –4 | –3 | –6 | –2 |
| Investments | |||||
| Past investments | 1 | –3 | –3 | –1 | 0 |
| Expected investments | 1 | –5 | –1 | 1 | 1 |
- * Average of the balances of opinion since 1988
- Source: Insee
graphiqueGraph1 – Composite indicator

graphiquegraph_retourn – Turning point indicator

- Note: close to 1 (respectively -1), this indicator indicates a favorable short-term economic situation (respectively unfavorable).
graphiqueGraph2 – Activity
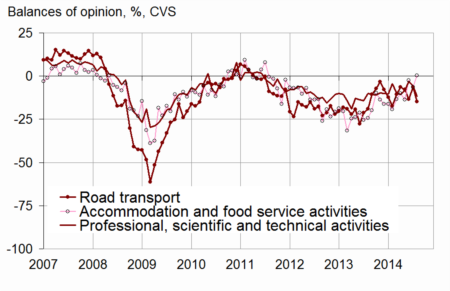
Road transport
In road freight and mail activities, the balance of opinion on past activity has recovered. Conversely, the balances of opinion on expected activity and expected demand have gone down.
Accommodation and food service activities
In accommodation and food service activities, business managers consider that their activity has accelerated over the recent period. Their business prospects over the next few months have recovered.
Information and communication
In information and communication, the balance of opinion on past activity has remained below its long-term average. Compared with July, business managers have hardly changed their forecasts of activity and demand.
Real estate activities
In real estate activities, the balances of opinion on past activity and on expected activity have remained virtually unchanged.
Professional, scientific and technical activities
In professional, scientific and technical activities, business managers consider that activity has slowed down in the recent months. Their business expectations have deteriorated.
Administrative and support service activities
In administrative and support service activities, the balance of opinion on past activity has remained stable below its long-term average. The balance of opinion on expected activity has increased.
graphiquegraph_bonus_ – Expected activity
tableauTable_det – Detailed data
| A21 | Average* | May 14 | June 14 | July 14 | Aug. 14 |
|---|---|---|---|---|---|
| (H) Road transport | |||||
| Past activity | –8 | –8 | –2 | –10 | 0 |
| Expected activity | –10 | –8 | –13 | –6 | –15 |
| Expected demand | –13 | –13 | –14 | –6 | –19 |
| Past employment | –8 | –9 | –10 | –11 | –9 |
| Expected employment | –11 | –10 | –9 | –7 | –7 |
| (I) Accommodation and food service activities | |||||
| Past activity | –7 | –9 | –14 | –18 | –1 |
| Expected activity | –7 | –14 | –3 | –6 | 0 |
| Expected demand | –9 | –20 | –7 | –6 | –10 |
| Past employment | –4 | –9 | –1 | 4 | –2 |
| Expected employment | –5 | –12 | 1 | –10 | –3 |
| (J) Information and communication | |||||
| Past activity | 9 | –8 | –21 | –9 | –11 |
| Expected activity | 11 | –27 | –20 | –2 | –1 |
| Expected demand | 11 | –2 | –8 | –2 | –3 |
| Past employment | 7 | –7 | –11 | –2 | –2 |
| Expected employment | 11 | –1 | –4 | –13 | –8 |
| (L) Real estate activities | |||||
| Past activity | 7 | 5 | 5 | 6 | 5 |
| Expected activity | 7 | 9 | 2 | 0 | 2 |
| Expected demand | 1 | –5 | –4 | –3 | 0 |
| Past employment | 3 | –5 | –4 | 2 | –2 |
| Expected employment | 2 | –2 | 0 | 6 | 11 |
| (M) Professional, scientific and technical activities | |||||
| Past activity | –1 | –5 | –6 | –5 | –8 |
| Expected activity | –2 | –8 | –3 | –6 | –12 |
| Expected demand | –5 | –12 | –12 | –14 | –15 |
| Past employment | 1 | 1 | 3 | 0 | 2 |
| Expected employment | 0 | –1 | –5 | –1 | –4 |
| (N) Administrative and support service activities | |||||
| Past activity | 6 | 8 | –3 | –4 | –4 |
| Expected activity | 5 | –3 | –2 | 3 | 8 |
| Expected demand | 3 | –5 | –7 | –2 | –3 |
| Past employment | 8 | 15 | 6 | 6 | 7 |
| Expected employment | 6 | 2 | –1 | 7 | 4 |
- * Average of the balances of opinion since 1988 (2006 for road transport)
Documentation
Methodology (2016) (pdf,158 Ko)
Pour en savoir plus
Time series : Economic outlook surveys – Services
