


 23 June 2015
2015- n° 151In June 2015, the business climate remains good in the retail trade and in the trade
and repair of motor vehicles Monthly survey of retailing - June 2015
23 June 2015
2015- n° 151In June 2015, the business climate remains good in the retail trade and in the trade
and repair of motor vehicles Monthly survey of retailing - June 2015
According to the managers surveyed in June 2015, the business climate remains good in the retail trade and in the trade and repair of motor vehicles. The corresponding synthetic indicator is stable. It has been over its long-term average since the beginning of the year.
According to the managers surveyed in June 2015, the business climate remains good in the retail trade and in the trade and repair of motor vehicles. The corresponding synthetic indicator is stable. It has been over its long-term average since the beginning of the year.
graphiquegraph_indsynt_en – Business climate synthetic indicator
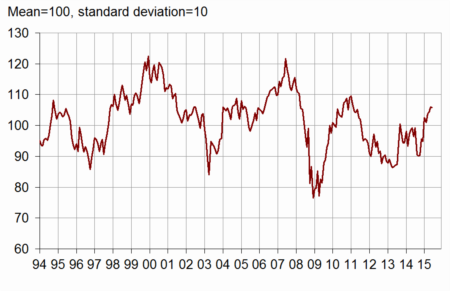
Expectations over their average
A few more managers have indicated that their past activity has slowed down, the corresponding balance returning to its average. According to each sector, the situation is different: the balance has still remained very high in motor car trade, but has stayed under its average in retail trade.
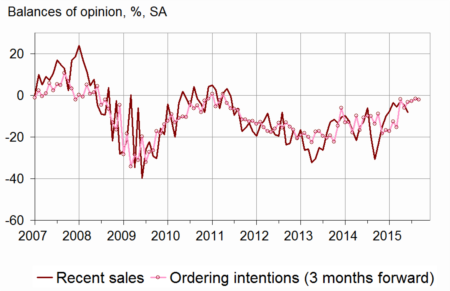
Regarding their forecasts, managers are waiting to see: the expected sales balance has declined, those corresponding to ordering intentions and general business outlook have been virtually stable. Nevertheless, each of the three balances has remained over its average.
Stocks have been replenished, but their level is still estimated below average.
Fewer business leaders than in May expect price falls over the next few months.
graphiqueGraph_ventes_ic_en – Recent sales and ordering intentions
tableautab1_en – Global data
| Ave. (1) | March 15 | April 15 | May 15 | June 15 | |
|---|---|---|---|---|---|
| Business climate | 100 | 104 | 104 | 106 | 106 |
| General business outlook | –30 | –29 | –26 | –24 | –22 |
| Recent sales | –7 | –6 | –3 | –5 | –8 |
| Expected sales | –3 | 5 | 0 | 6 | 0 |
| Ordering intentions | –9 | –3 | –3 | –2 | –2 |
| Stocks | 10 | 11 | 4 | 3 | 8 |
| Past selling prices (2) | –6 | –12 | –8 | ||
| Expected selling prices | –3 | –8 | –5 | –8 | –4 |
| Cash position (2) | –15 | –18 | –18 | ||
| Workforce size: recent trend | 0 | –8 | –3 | –1 | –1 |
| Workforce size: future trend | –3 | –5 | –7 | –4 | –5 |
- (1) Average since 1991 (2004 for recent and expected sales and ordering intentions).
- (2) Bi-monthly question (odd-numbered months).
- Source: monthly survey in the retail trade and in the trade and repair of motor vehicles - INSEE
Opinion about employment is near its average
Each of both balances concerning recent and future trends on workforce size is almost unchanged, just below its mean level.
Retail trade
Still sluggish past activity
In non-specialised trade, more retailers than in May have declared a fall in their past sales, while they are fewer in the specialised trade. However, each of both balances is still under its mean level.
In the retail trade as a whole, forecasts have been globally less optimistic than in May: each of the balances concerning expected sales and ordering intentions has slightly fallen back, being now near its average. Nevertheless, in specialised trade, the ordering intentions balance has risen and is now over its mean level.
Fewer non-specialised and specialised retailers expect price falls in the next few months.
Trade and repair of motor vehicles
Still dynamic activity
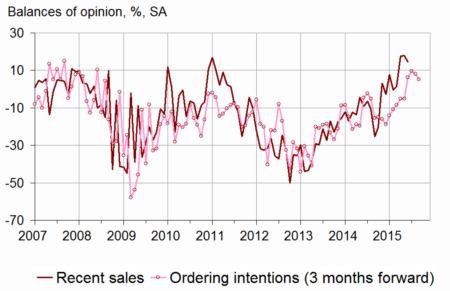
According to the managers in trade and repair of motor vehicles, past activity has remained good: although the corresponding balance has slightly decreased, it has stayed very high. Their anticipations are still optimistic: both balances concerning expected sales and ordering intentions have moderately changed, but are still at high levels.
graphiquegraph_ventes_ic_auto_en – Recent sales and ordering intentions in motor vehicles
More managers than in May expect rises in prices over the next few months.
Balances concerning recent and future trends in workforce size have remained well over their average.
tableautab2_en – Detailed data
| Ave. (1) | March 15 | April 15 | May 15 | June 15 | |
|---|---|---|---|---|---|
| Retail trade - Global data | |||||
| Recent sales | –6 | –8 | –11 | –14 | –17 |
| Expected sales | –1 | 3 | –2 | 6 | –2 |
| Ordering intentions | –7 | –6 | –4 | –3 | –6 |
| Stocks | 10 | 12 | 0 | 0 | 8 |
| Past selling prices (2) | –8 | –19 | –12 | ||
| Expected selling prices | –5 | –14 | –9 | –12 | –8 |
| Cash position (2) | –13 | –18 | –18 | ||
| Workforce size: recent trend | 1 | –9 | –3 | –1 | 0 |
| Workforce size: future trend | –2 | –6 | –9 | –5 | –6 |
| Non-specialised retail trade | |||||
| Recent sales | –2 | 5 | –1 | –5 | –18 |
| Expected sales | 5 | 16 | 7 | 17 | 6 |
| Ordering intentions | 1 | 2 | 11 | 9 | 3 |
| Stocks | 7 | 13 | –9 | –9 | 4 |
| Past selling prices (2) | –8 | –25 | –10 | ||
| Expected selling prices | –5 | –13 | –10 | –13 | –6 |
| Cash position (2) | –7 | –9 | –11 | ||
| Specialised retail trade | |||||
| Recent sales | –11 | –25 | –23 | –25 | –17 |
| Expected sales | –8 | –15 | –13 | –8 | –11 |
| Ordering intentions | –17 | –18 | –20 | –20 | –13 |
| Stocks | 14 | 10 | 12 | 12 | 13 |
| Past selling prices (2) | –8 | –15 | –17 | ||
| Expected selling prices | –5 | –14 | –9 | –12 | –9 |
| Cash position (2) | –22 | –28 | –26 | ||
| Trade and repair of motor cars and motorcycles | |||||
| Recent sales | –10 | 2 | 18 | 18 | 15 |
| Expected sales | –9 | 11 | 7 | 5 | 8 |
| Ordering intentions | –13 | 6 | 10 | 8 | 5 |
| Stocks | 15 | 10 | 12 | 10 | 8 |
| Past selling prices (2) | 1 | 7 | 4 | ||
| Expected selling prices | 4 | 6 | 7 | 3 | 5 |
| Cash position (2) | –25 | –17 | –15 | ||
| Workforce size: recent trend | –10 | –7 | –4 | 0 | –3 |
| Workforce size: future trend | –8 | –2 | –1 | 0 | –1 |
- (1) Average since 1991 (2003 for trade and repair of motor vehicles and 2004 for recent and expected sales and ordering intentions).
- (2) Bi-monthly question (odd-numbered months).
- Source: monthly survey in the retail trade and in the trade and repair of motor vehicles - INSEE
Documentation
Methodology (pdf,129 Ko)
Pour en savoir plus
