


 20 November 2015
2015- n° 280In August 2015, producer costs for construction decreased Costs of production indices in construction - August 2015
20 November 2015
2015- n° 280In August 2015, producer costs for construction decreased Costs of production indices in construction - August 2015
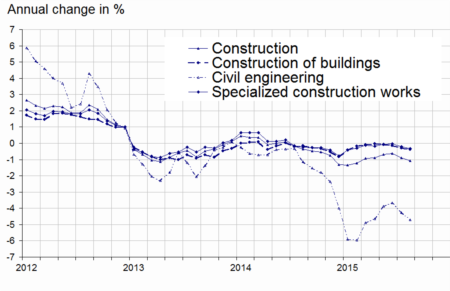
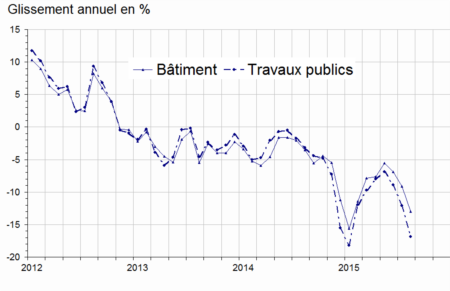
In August 2015, producer costs in construction decreased compared to July 2015 (–0.3%), quite clearly in civil engineering (–0.9%), moderately in specialised construction activities (–0.2%). They were virtually unchanged in building construction (–0.1%). Over a year, producer costs in construction continued to decline (–1.1%), due to a sharp drop in civil engineering (–4.7%), and a moderate one in the construction of buildings (–0.4%) and specialised construction activities (–0.3%).
In August 2015, producer costs in construction decreased compared to July 2015 (–0.3%), quite clearly in civil engineering (–0.9%), moderately in specialised construction activities (–0.2%). They were virtually unchanged in building construction (–0.1%). Over a year, producer costs in construction continued to decline (–1.1%), due to a sharp drop in civil engineering (–4.7%), and a moderate one in the construction of buildings (–0.4%) and specialised construction activities (–0.3%).
tableautablo1 – Producer cost indices for construction
| NAF | Heading | Weights (in %) | August 15/ July 15 | August 15/ August 14 |
|---|---|---|---|---|
| F | Construction | 100.0 | - 0.3 | - 1.1 |
| 41.2 | Construction of buildings | 10.1 | - 0.1 | - 0.4 |
| 42 | Civil engineering | 16.2 | - 0.9 | - 4.7 |
| 43 | Specialised construction works | 73.7 | - 0.2 | - 0.3 |
| 43BT | Buildings | 64.2 | - 0.1 | + 0.1 |
| 43BTC | New buildings | 24.6 | - 0.1 | - 0.3 |
| 43BTR | Existing buildings | 39.6 | - 0.1 | + 0.4 |
| 43TP | Specialised works for civil engineering | 9.5 | - 0.7 | - 3.4 |
| BT | Buildings (41.2 + 43BT) | 74.3 | - 0.1 | + 0.1 |
| TP | Public works (42 + 43TP) | 25.7 | - 0.8 | - 4.2 |
- Source: INSEE
tableautablo2 – Items of producer cost indices for construction
| Costs | items | Q2 15 / Q1 15 | Q3 15 / Q2 15 | July 15/ June 15 | July 15/ July 14 | |
|---|---|---|---|---|---|---|
| Equipment | Buildings - structural works | + 0.1 | - 0.2 | - 0.3 | + 2.7 | |
| Buildings - finishing | 0.0 | - 0.4 | - 0.7 | + 4.1 | ||
| Public works | - 0.1 | - 0.1 | + 0.1 | + 0.8 | ||
| Labour | Labour costs in construction | - 0.4 | /// | /// | /// | |
| Energy | Buildings | + 4.3 | - 5.8 | - 5.1 | - 13.0 | |
| Public works | + 5.8 | - 8.3 | - 6.0 | - 16.9 | ||
| Material | Construction of buildings | - 0.1 | - 0.4 | + 0.0 | - 2.1 | |
| Existing buildings | - 0.3 | + 0.1 | + 0.1 | - 1.0 | ||
| Civil engineering | + 2.5 | - 0.6 | - 1.6 | - 11.0 | ||
| Specialised works for civil engineering | - 0.0 | + 0.1 | + 0.4 | - 0.7 | ||
| Services | Construction | + 0.2 | + 1.1 | - 0.3 | + 0.5 | |
| Transport | Buildings | + 1.3 | - 1.2 | - 1.1 | - 2.7 | |
| Public works | + 1.0 | 0.0 | 0.0 | - 0.9 | ||
- ///: Non-published estimation
- Source: INSEE
graphiqueGRCoutUK – Production costs in construction
- Source: INSEE
Materials
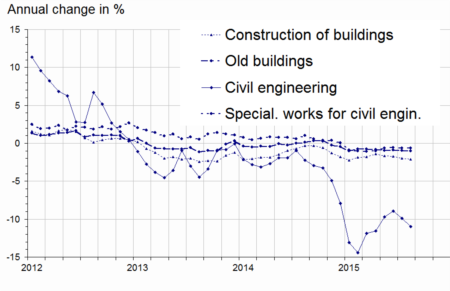
In August 2015, materials costs decreased sharply in civil engineering (–1.6%) whereas they increased in specialised works for civil engineering (+0.4%). They were stable in construction of buildings and virtually stable in the renovation of existing buildings (+0.1%): the price falls of bitumen (–7.4%) and of copper tubes and pipes (–3.3%) were almost offset by the increase in prices of other materials (notably electrical materials, painting).
graphiqueGRMUK – Materials costs
- Source: INSEE
Equipment
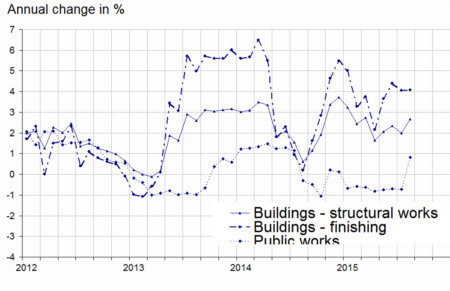
In August 2015, equipment costs fell back in finishing (–0.7% as in the previous month) due to lower prices of machine tools. To a lesser extent, they also declined in structural works (–0.3% after –0.4%). They were virtually flat in public works (+0.1% after –0.1%).
graphiqueGRKUK – Equipment cost
- Source: INSEE
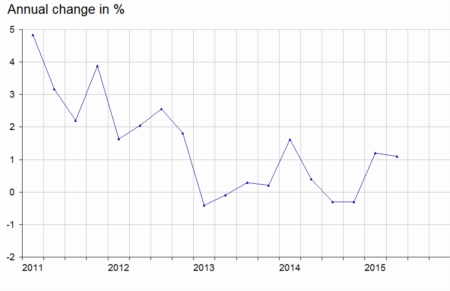
graphiqueGRtravailUK – Labour cost in construction
- Source: INSEE
Energy
In August 2015, energy costs fell more sharply in construction of buildings (–5.1% after –2.3%, –13.0% over a year), due to the decrease in diesel oil prices. The cost of energy decreased even more in public works (–6.0% after –3.9%; –16.9% over a year), due to a further decline in the price of heavy fuel oil.
graphiqueGRenergie – Energy cost
- Source: INSEE
tableaurevisionUK – Revisions of costs of production indices in construction
| May 15 | June 15 | July 15 | ||
|---|---|---|---|---|
| F | Construction | /// | 0.1 | /// |
| 41.2 | Construction of buildings | /// | /// | /// |
| 42 | Civil engineering | 0.1 | 0.4 | -0.1 |
| 43 | Specialised construction works | /// | 0.1 | /// |
- Reading note: producer cost for construction between May and June 2015 published in October 2015 has been updated from –0.1% to 0.0%, that is to say an upward revision by 0.1 points.
- Source: INSEE
Pour en savoir plus
Time series : Producer cost indices for construction
