


 27 August 2014
2014- n° 193In August 2014, the business climate indicator plummets in the retail trade and in
the trade and repair of motor vehicles Monthly survey of retailing - August 2014
27 August 2014
2014- n° 193In August 2014, the business climate indicator plummets in the retail trade and in
the trade and repair of motor vehicles Monthly survey of retailing - August 2014
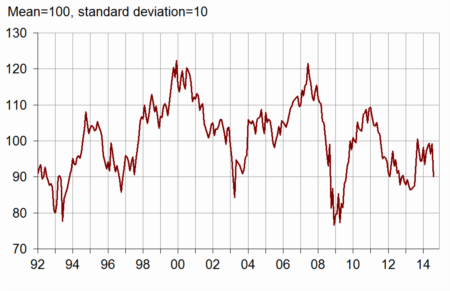
According to the managers surveyed in August 2014, the business climate synthetic indicator plummets in the retail trade and in the trade and repair of motor vehicles. It has lost nine points and has come back to his level of July-August 2013.
According to the managers surveyed in August 2014, the business climate synthetic indicator plummets in the retail trade and in the trade and repair of motor vehicles. It has lost nine points and has come back to his level of July-August 2013.
graphiquegraph_indsynt_en – Business climate synthetic indicator
Lower past and expected activities
According to the business leaders, past activity has declined over the last few months. This decrease might go on, as expected sales and ordering intentions show it. Each of the three balances has significantly dropped, being substantially under its average from now on. However general business outlook have just slightly declined, showing that the managers could be only moderatly pessimistic about the economic situation in the trade sector.
More business leaders than in July expect a fall in prices: the corresponding balance is still very low.
graphiqueGraph_ventes_ic_en – Recent sales and ordering intentions

tableautab1_en – Global data
| Ave. (1) | May 14 | June 14 | July 14 | Aug. 14 | |
|---|---|---|---|---|---|
| Business climate | 100 | 99 | 96 | 99 | 90 |
| General business outlook | –30 | –33 | –34 | –35 | –40 |
| Recent sales | –7 | –15 | –13 | –6 | –18 |
| Expected sales | –3 | –6 | –13 | –4 | –22 |
| Ordering intentions | –9 | –10 | –14 | –9 | –20 |
| Stocks | 11 | 7 | 7 | 6 | 5 |
| Past selling prices (2) | –6 | –17 | –16 | ||
| Expected selling prices | –3 | –15 | –15 | –10 | –14 |
| Cash position (2) | –15 | –18 | –20 | ||
| Workforce size: recent trend | 0 | –3 | –2 | 0 | –2 |
| Workforce size: future trend | –2 | –3 | –6 | –6 | –11 |
- (1) Average since 1991 (2004 for recent and expected sales and ordering intentions).
- (2) Bi-monthly question (odd-numbered months).
- Source: monthly survey in the retail trade and in the trade and repair of motor vehicles - INSEE
More job losses
According to the business managers, workforce trend has remained stable over the last few months, but might come down over the next few months, especially in retail trade.
Retail trade
Depressed activity in retail trade
According to the retailers, past and expected sales and ordering intentions have sharply decreased: each of the three balances has fallen, being from now on at a low level. This decline is a little more important in non-specialized trade than in specialized one.
In the whole retail trade, the level of stocks is still estimed lower than its normal level.
Less retailers than in July expect a fall in prices. The corresponding balance has progressed for the three straight months.
Trade and repair of motor vehicles
graphiquegraph_ventes_ic_auto_en – Recent sales and ordering intentions in motor vehicles

Rather optimistic past activity
In trade and repair of motor vehicles, the managers have declared that their past activity has stabilized, the corresponding balance staying above its average. However, expected sales and ordering intentions have slightly declined, each of both balances being under its mean level.
Stocks have been estimed under their normal level for more than one year.
Many more motor vehicles leaders than over the last month expect decreases in prices over the next few months. The corresponding balance has come back to the low level of the end of 2012.
tableautab2_en – Detailed data
| Ave. (1) | May 14 | June 14 | July 14 | Aug. 14 | |
|---|---|---|---|---|---|
| Retail trade - Global data | |||||
| Recent sales | –5 | –20 | –14 | –6 | –22 |
| Expected sales | 0 | –5 | –12 | –4 | –22 |
| Ordering intentions | –7 | –10 | –14 | –10 | –21 |
| Stocks | 10 | 8 | 7 | 6 | 4 |
| Past selling prices (2) | –8 | –22 | –22 | ||
| Expected selling prices | –5 | –22 | –21 | –17 | –14 |
| Cash position (2) | –13 | –17 | –18 | ||
| Workforce size: recent trend | 1 | 1 | 0 | 3 | 0 |
| Workforce size: future trend | –2 | –1 | –4 | –5 | –11 |
| Non-specialized retail trade | |||||
| Recent sales | –2 | –22 | –15 | 4 | –19 |
| Expected sales | 5 | 3 | –9 | 6 | –18 |
| Ordering intentions | 1 | –2 | –6 | 1 | –12 |
| Stocks | 7 | 2 | 4 | 3 | 4 |
| Past selling prices (2) | –8 | –29 | –29 | ||
| Expected selling prices | –5 | –26 | –23 | –21 | –17 |
| Cash position (2) | –7 | –9 | –9 | ||
| Specialized retail trade | |||||
| Recent sales | –10 | –17 | –13 | –18 | –26 |
| Expected sales | –7 | –14 | –15 | –19 | –25 |
| Ordering intentions | –17 | –21 | –20 | –21 | –27 |
| Stocks | 14 | 14 | 11 | 10 | 4 |
| Past selling prices (2) | –8 | –16 | –11 | ||
| Expected selling prices | –5 | –16 | –18 | –12 | –10 |
| Cash position (2) | –22 | –26 | –27 | ||
| Trade and repair of motor cars and motorcycles | |||||
| Recent sales | –11 | –4 | –9 | –6 | –7 |
| Expected sales | –10 | –11 | –14 | –8 | –19 |
| Ordering intentions | –14 | –5 | –16 | –15 | –18 |
| Stocks | 15 | 5 | 6 | 3 | 6 |
| Past selling prices (2) | 1 | –4 | –3 | ||
| Expected selling prices | 4 | 2 | 0 | 7 | –10 |
| Cash position (2) | –26 | –19 | –22 | ||
| Workforce size: recent trend | –10 | –15 | –9 | –8 | –8 |
| Workforce size: future trend | –8 | –10 | –14 | –11 | –13 |
- (1) Average since 1991 (2003 for trade and repair of motor vehicles and 2004 for recent and expected sales and ordering intentions).
- (2) Bi-monthly question (odd-numbered months).
- Source: monthly survey in the retail trade and in the trade and repair of motor vehicles - INSEE
Documentation
Methodology (pdf,129 Ko)
Pour en savoir plus
