


 19 December 2014
2014- n° 294In December 2014, the business climate stagnates in services Monthly survey of services - December 2014
19 December 2014
2014- n° 294In December 2014, the business climate stagnates in services Monthly survey of services - December 2014
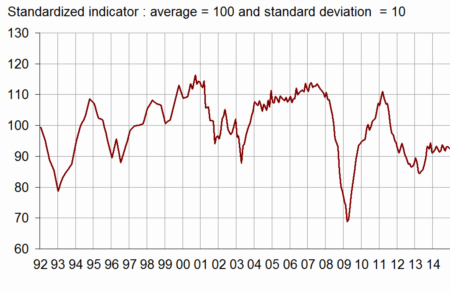
According to business managers, the economic situation in services is stable in December 2014. The business climate composite indicator stands at 93 for the third consecutive month, still below its long-term average (100). The turning point indicator still indicates a favorable dynamic.
All services
According to business managers, the economic situation in services is stable in December 2014. The business climate composite indicator stands at 93 for the third consecutive month, still below its long-term average (100). The turning point indicator still indicates a favorable dynamic.
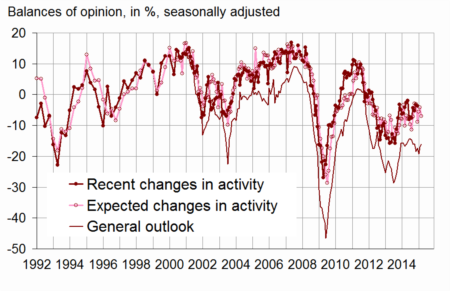
The balance on the general outlook, which relates the assessment of business leaders over their whole sector, remains low.
graphiqueGraph1 – Composite indicator
graphiquegraph_retourn – Turning point indicator
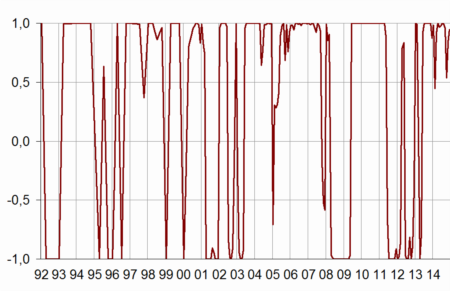
- Note: close to 1 (respectively -1), this indicator indicates a favorable short-term economic situation (respectively unfavorable).
The balances of opinion on past and expected activity have decreased slightly and stand below their long-term average. Business leaders’ expectations on demand remain pessimistic.
The balance of opinion on past employment has declined moderately whereas the balance on expected employment has recovered. These balances stand below their long-term average.
tableauTable_quarter – Economic outlook in the services sector
| Average* | Sept. 14 | Oct. 14 | Nov. 14 | Dec. 14 | |
|---|---|---|---|---|---|
| Composite indicator | 100 | 92 | 93 | 93 | 93 |
| General outlook | –8 | –17 | –19 | –17 | –16 |
| Past activity | 2 | –4 | –5 | –3 | –4 |
| Expected activity | 2 | –9 | –6 | –4 | –7 |
| Expected demand | –1 | –7 | –7 | –9 | –8 |
| Business situation | –3 | –12 | –8 | –6 | –9 |
| Past selling prices | –3 | –10 | –9 | –8 | –11 |
| Expected selling prices | –2 | –10 | –10 | –10 | –13 |
| Past employment | 3 | –1 | 4 | –2 | –4 |
| except temporary work agencies | 1 | 0 | 0 | 0 | –3 |
| Expected employment | 2 | 0 | 0 | –1 | 1 |
| except temporary work agencies | –1 | –3 | –5 | –5 | –3 |
| Investments | |||||
| Past investments | 1 | 3 | –1 | –1 | –6 |
| Expected investments | 1 | –1 | –1 | –2 | 1 |
- * Average of the balances of opinion since 1988
- Source: Insee
graphiqueGraph2 – Activity
Road transport
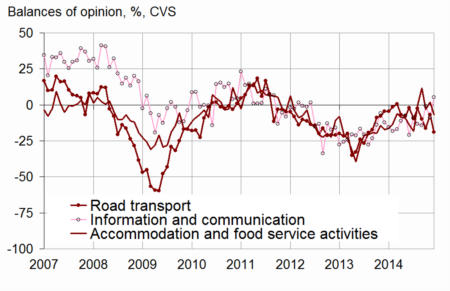
In road freight and mail activities, the balances of opinion on past activity and expected demand have gone down significantly. They stand below their long-term average. Business leaders’ expectations on activity are also more pessimistic than in November. However, the balances of opinion on past and expected employment have gone up and stand above their long-term average.
Accommodation and food service activities
In accommodation and food service activities, the balance of opinion on past activity has declined and comes back to its long-term average. Business leaders’ expectations on activity and demand over the next few months are quasi stable. The corresponding balances remain below their long-term average. The balances of opinion on employment have recovered.
Information and communication
In information and communication, the balance of opinion on past activity has recovered sharply and comes closer to its long-term average. Nevertheless, business managers are more pessimistic than in November on expected activity and their prospects on demand remain deteriorated.
Real estate
In real estate, the balances of opinion on past and expected activity are quasi stable and stand close to their long-term average. More business managers than in November anticipate an increase in demand.
Professional, scientific and technical activities
In professional, scientific and technical activities, the balances of opinion and past activity, expected activity and expected demand are quasi stable and below their long-term average.
Administrative and support service activities
In administrative and support service activities, the balance of opinion on past activity has declined. The balances on expected activity and expected demand have increased slightly but they stay below their long-term average.
graphiquegraph_bonus_ – Past activity
tableauTable_det – Detailed data
| A21 | Average* | Sept. 14 | Oct. 14 | Nov. 14 | Dec. 14 |
|---|---|---|---|---|---|
| (H) Road transport | |||||
| Past activity | –8 | –10 | –16 | –7 | –19 |
| Expected activity | –10 | –8 | –10 | –8 | –11 |
| Expected demand | –13 | –13 | –10 | –9 | –17 |
| Past employment | –8 | –8 | –16 | –8 | –3 |
| Expected employment | –11 | –1 | –9 | –10 | –3 |
| (I) Accommodation and food service activities | |||||
| Past activity | –7 | 12 | –3 | 2 | –7 |
| Expected activity | –7 | –19 | –10 | –9 | –9 |
| Expected demand | –9 | –12 | –11 | –10 | –13 |
| Past employment | –4 | 13 | 7 | –5 | –2 |
| Expected employment | –5 | –6 | –13 | –19 | –12 |
| (J) Information and communication | |||||
| Past activity | 9 | –14 | –1 | –9 | 5 |
| Expected activity | 10 | –12 | –8 | –10 | –15 |
| Expected demand | 11 | –11 | –5 | –8 | –8 |
| Past employment | 6 | –12 | –9 | –4 | –2 |
| Expected employment | 11 | 1 | 3 | 5 | 2 |
| (L) Real estate activities | |||||
| Past activity | 7 | 1 | –2 | 7 | 8 |
| Expected activity | 7 | 3 | 5 | 4 | 5 |
| Expected demand | 1 | –5 | –5 | –4 | –1 |
| Past employment | 3 | –6 | 8 | –4 | 0 |
| Expected employment | 2 | 10 | 5 | 1 | –2 |
| (M) Professional, scientific and technical activities | |||||
| Past activity | –1 | –4 | –8 | –7 | –8 |
| Expected activity | –2 | –14 | –7 | –8 | –9 |
| Expected demand | –6 | –13 | –9 | –14 | –14 |
| Past employment | 1 | –3 | 0 | 1 | 2 |
| Expected employment | 0 | –5 | –3 | –7 | –4 |
| (N) Administrative and support service activities | |||||
| Past activity | 6 | –2 | –4 | –3 | –10 |
| Expected activity | 5 | 2 | –1 | –1 | 1 |
| Expected demand | 3 | –2 | –3 | –4 | 2 |
| Past employment | 8 | –1 | 12 | 1 | –2 |
| Expected employment | 6 | 3 | 6 | 11 | 9 |
- * Average of the balances of opinion since 1988 (2006 for road transport)
Documentation
Methodology (2016) (pdf,158 Ko)
Pour en savoir plus
Time series : Economic outlook surveys – Services
