


 30 October 2015
2015- n° 270In September 2015, overall agricultural producer prices rose by 1.1 % Indices of agricultural prices - septembre 2015
30 October 2015
2015- n° 270In September 2015, overall agricultural producer prices rose by 1.1 % Indices of agricultural prices - septembre 2015
In September 2015, overall agricultural producer prices rose by 1.1 % compared to the previous month and by 1.6 % over one year
In September 2015, overall agricultural producer prices rose by 1.1 % compared to the previous month and by 1.6 % over one year
Fall in prices of cereals and oleaginous
Cereal prices plummeted again in September (–5.3 %, after –10,0 % in August), due to the abundance of the global supply, noticeably from the Black Sea region for soft wheat and maïze.
graphiquecereal – Producer prices of cereals

- Source : Insee
Oleaginous prices fell by 6.8 % over three months despite a lower rape production at a global scale. The drop in oil price makes indeed the biodiesel price, derived from rape, less attractive.
Rebound in the prices of potatoes
In September, potatoe prices increased by more than 60 % yoy. The 2015 crop reached its long-term average whereas the previous one was exceptional. Conversely, industrial bett price fell by almost 20 % yoy, dragged down by the drop in sugar price.
Rise in the prices of fresh fruits and vegetables
Fresh fruits prices increased sharply over 12 months (+16.5 % yoy), and noticeably apple price : (+ 24.4 %). The low prices last year reflected the congestion in the supply in relation with an abundant European crop and the Russian embargo since August 2014.
Pears prices went up as well because the cooler temperatures this year prompted the automn fruit demand.
graphiquevegetable – Producer prices of fresh vegetables

- Source : SSP (ministry of agriculture)
Fresh vegetables prices increased by 19.0 % yoy. Prices of tomatoes and melons rose due to bad weather conditions, that reduced outdoor growing yields.
Slight downturn in the prices of animals
On a seasonally adjusted basis, prices of animals went down (–0.5 %) this month.
graphiquepig – Producer prices of pigs and large cattle
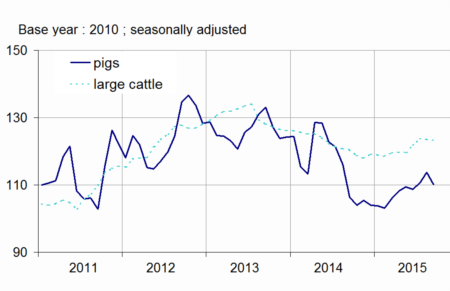
- Source : Insee
Prices of calves slip by 5 % over one year due to a sluggish consumption. Egg prices jumped (+13.9 % over one year), further to the sharp increase in European exportations towards the United-States: avian flue struck that country last spring and devastated the livestock. Milk prices went down sharply by 13.8 % over one year: in 2014, the high prices and the strong Chinese demand had encouraged American, New Zealand and European farmers to boost their productions, however, since then, the drop in Chinese importations and the Russian embargo had slowed down the global demand.
tableauTab1 – Indices of producer prices of agricultural products (IPPAP)
| weights | Sept. 2015 | Variation as % over | |||
|---|---|---|---|---|---|
| a month | 3 months | a year | |||
| raw | Seasonally adjusted | raw | |||
| Agricultural goods output | 1000 | 113.9 | +1.1 | +0.9 | +1.6 |
| excluding fruits and vegetables | 900 | 114.2 | -0.0 | 0.0 | +0.3 |
| Crop output (excluding fruits and vegetables) | 505 | 113.3 | +0.1 | –1.1 | +4.4 |
| Cereals | 188 | 99.5 | –5.3 | –5.2 | +2.3 |
| of which soft wheat | 112 | 92.7 | –5.1 | –7.5 | –0.5 |
| grain maize | 41 | 94.7 | –5.8 | +0.2 | +13.6 |
| Potatoes | 26 | 150.1 | /// | /// | +60.6 |
| Wines | 177 | 128.9 | +0.6 | –1.2 | +0.3 |
| Protected designation of origin | 84 | 133.2 | +1.2 | –1.0 | –2.8 |
| other wines | 23 | 148.1 | –0.2 | –4.1 | +12.6 |
| Oleaginous | 49 | 99.5 | –1.1 | –6.8 | +18.7 |
| Horticultural products | 30 | 106.3 | –0.4 | –0.7 | +0.2 |
| Other crop products | 36 | 106.7 | –1.1 | 0.0 | –8.0 |
| Fruits and vegetables (1) | 100 | 111.2 | /// | /// | +15.3 |
| Fresh vegetables | 53 | 111.1 | /// | /// | +19.0 |
| Fresh fruits | 35 | 110.4 | /// | /// | +16.5 |
| Animal output | 395 | 115.3 | –0.1 | +1.5 | –4.5 |
| Animals | 234 | 117.1 | –0.5 | +1.1 | +0.9 |
| of which large cattle | 96 | 123.5 | –0.3 | +1.3 | +2.3 |
| calves | 26 | 101.3 | +1.1 | –0.8 | –5.0 |
| pigs | 54 | 118.6 | –3.2 | +1.3 | +3.5 |
| sheep | 10 | 118.4 | +3.0 | +3.1 | +3.3 |
| poultry | 46 | 111.3 | +0.6 | +1.1 | –2.1 |
| of which chicken | 28 | 111.6 | +0.9 | +1.5 | –2.0 |
| Milk | 147 | 110.6 | 0.0 | +1.7 | –13.8 |
| of which cow milk (2) | 137 | 110.4 | 0.0 | +1.8 | –14.7 |
| Eggs | 15 | 132.7 | +5.3 | +6.7 | +13.9 |
- (1) Including vegetables for industry.
- (2)The price for Sept. is not yet known and therefore is estimated by carrying forward the seasonally adjusted price of August.
- Sources: Insee - SSP (ministry of agriculture)
Purchase prices of means of production are virtually stable in September
In September, the purchase prices of means of production were virtually stable (–0,1%), notably those of intermediate consumption prices. Prices of animal feed fell (–0,4%) whereas energy prices rebounded in September (+ 0.7 % mom, – 20 % yoy). Capital goods prices declinded by 0.4 %.
graphiquemeans – Purchase prices of the means of agricultural production
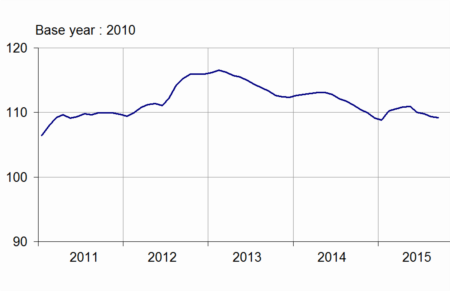
- Sources : Insee et SSP (ministry of Agriculture)
tableauTab2 – Indices of purchase prices of the means of agricultural production (IPAMPA)
| weights | Sept. 2015 | Variation as % over | |||
|---|---|---|---|---|---|
| a month | 3 months | a year | |||
| Total input | 1000 | 109.2 | –0.1 | –0.8 | –1.8 |
| Intermediate consumptions | 764 | 110.1 | –0.1 | –1.0 | –2.5 |
| Energy | 100 | 95.1 | +0.7 | –8.4 | –18.3 |
| Seeds | 57 | 108.9 | 0.0 | +0.3 | +0.4 |
| Fertilisers and soil improvers | 92 | 117.5 | +0.1 | –0.4 | +2.4 |
| Plant protection products | 78 | 100.7 | 0.0 | –0.3 | –0.6 |
| Animal feed | 205 | 117.5 | –0.4 | –0.1 | –2.0 |
| Veterinary expenses | 43 | 114.5 | –0.1 | +0.4 | +2.2 |
| Small equipment and tools | 17 | 109.5 | –0.1 | +0.7 | –0.1 |
| Maintenance of materials | 67 | 113.3 | 0.0 | +0.3 | +1.8 |
| Maintenance of buildings | 9 | 107.1 | +0.1 | +0.3 | –0.1 |
| Other goods and services | 97 | 101.4 | –0.1 | 0.0 | –0.4 |
| Goods and services contributing to investment | 236 | 106.6 | –0.4 | +0.1 | +0.9 |
| Material | 186 | 107.2 | –0.4 | +0.2 | +1.3 |
| Tractors | 79 | 107.0 | –0.5 | +0.8 | +2.3 |
| Machinery and plant for cultivation | 36 | 109.4 | –0.1 | +0.4 | +1.6 |
| Machinery and plant for harvesting | 42 | 107.1 | –0.6 | –0.7 | +0.2 |
| Utility vehicles | 18 | 104.3 | –0.5 | –0.4 | –0.7 |
| Buildings | 50 | 104.7 | 0.0 | –0.1 | –0.4 |
- (1) The repayment of the domestic tax on energy products (TICPE) benefiting farmers has been applied in advance for the year 2015
- Sources: Insee - SSP (ministry of agriculture)
Documentation
Methodology (pdf,122 Ko)
Pour en savoir plus
Time series : Indices of agricultural prices
