


 30 September 2015
2015- n° 238Household consumption of goods increased slightly in early summer (+0.3% in July
and +0.0% in August) Household consumption expenditure on goods - July - August 2015
30 September 2015
2015- n° 238Household consumption of goods increased slightly in early summer (+0.3% in July
and +0.0% in August) Household consumption expenditure on goods - July - August 2015
Household consumption expenditure on goods grew by 0.3% in July (in volume*, after +0.4% in June) and was stable in August. In July, consumption was led by expenditure on energy (+1.5%), textile, clothing and leather (+2.0%) and household durables (+2.1%); nevertheless car purchases declined (–1.3%). In August, smaller changes for most of the goods offset each other. Measured consumption over the last three months increased by 0.7% compared to the previous three months.
Household consumption expenditure on goods grew by 0.3% in July (in volume*, after +0.4% in June) and was stable in August. In July, consumption was led by expenditure on energy (+1.5%), textile, clothing and leather (+2.0%) and household durables (+2.1%); nevertheless car purchases declined (–1.3%). In August, smaller changes for most of the goods offset each other. Measured consumption over the last three months increased by 0.7% compared to the previous three months.
Engineered goods : slight growth
After an increase in June (+0.4%), engineered goods consumption kept growing at the same pace in July (+0.4%), and then stabilised in August, to its highest level since March 2011.
Durables: stability
After an increase in June (+0.4%), expenditure on durable goods was stable in July and in August. Expenditure on household durables grew significantly in July (+2.1% after +0.5% in June) and then held steady in August. They went up by +1.9% over those three months, compared to the three previous ones, mainly buoyed by communication equipment purchases. However, car purchases stepped back in July (–1.3%) after four months of increase, and were stable in August.
Textile-clothing: strong rise in July, slight backlash in August
Consumption of textile, clothing and leather accelerated during July's sales (+2.0% after +0.3% in June), before receding in August (–0.3%). Over the last three months, it rose further compared to the preceding three months (+2.0%).
[* Volumes are chained and all figures are trading days and seasonally adjusted.]
graphiquegraph1_new_ang – Total consumption of goods

graphiquegraph2_new_ang – Food and engineered goods

graphiquegraph3_new_ang – Breakdown of engineered goods
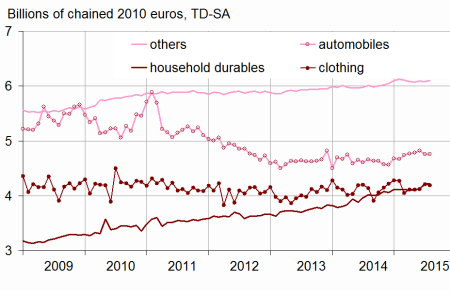
Other engineered goods: virtually stable
Consumption expenditure on other engineered goods decreased slightly in July (–0.2%), then went back up in August (+0.4%), particularly due to perfume purchases.
Food products: lowering in July and August
After an increase of +0.7% in June, consumption of food products fell back slightly in July (–0.3%) and in August (–0.2%). Consumption of tobacco contributed to limit the decline in July, but accentuated it in August.
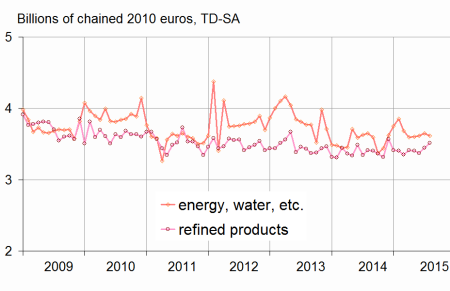
Energy: increasing anew
After a slight decrease in June (–0.3%), consumption of energy products climbed anew in July (+1.5%) and in August (+0.4%). Consumption of fuel increased sharply – +2.1% in July as in August –, mainly consumption of domestic heating oil, which jumped in August, stimulated by past price decreases.
The variation in June 2015 remains unchanged
Since the previous publication, new information has been integrated, and the seasonal adjustment coefficients were updated. However, the variation in household consumption of goods remains unchanged in June 2015 (+0.4%).
graphiquegraph4_new_ang – Energy
tableautab1_eng – Household consumption expenditure on goods
| Poids (1) | June | July | Aug. | Aug. 15 / Aug. 14 | Q / Q-1 (2) | |
|---|---|---|---|---|---|---|
| Food products | 38 | 0,7 | –0,3 | –0,2 | 1,2 | 0,5 |
| Engineered goods | 44 | 0,4 | 0,4 | 0,0 | 2,3 | 0,8 |
| - Inc. Durables | 21 | 0,4 | 0,0 | 0,0 | 3,2 | 0,7 |
| - Automobiles | 11 | 0,6 | –1,3 | 0,1 | 2,2 | 0,3 |
| - Household durables | 7 | 0,5 | 2,1 | 0,1 | 5,2 | 1,9 |
| - Inc. Textile-clothing | 10 | 0,3 | 2,0 | –0,3 | 1,2 | 2,0 |
| - Inc. Other engineered goods | 13 | 0,3 | –0,2 | 0,4 | 1,5 | 0,1 |
| Energy | 18 | –0,3 | 1,5 | 0,4 | 1,0 | 0,8 |
| - Inc. Energy, water, waste | 10 | 0,4 | 1,1 | –1,0 | –1,0 | 0,0 |
| - Inc. Refined Products | 9 | –1,0 | 2,1 | 2,1 | 3,0 | 1,6 |
| Total | 100 | 0,4 | 0,3 | 0,0 | 1,6 | 0,7 |
| - Inc. Manufactured goods | 85 | 0,2 | 0,3 | 0,3 | 2,2 | 0,7 |
- (1) Weighting in the consumption expenditure on goods in value
- (2) Last three months / previous three months
Documentation
Methodology (pdf,23 Ko)
Pour en savoir plus
