


 15 September 2015
2015- n° 222In August 2015, prices of frequently purchased goods increased slightly again in hyper
and supermarkets (+0.1%) Price Index in large and predominantly-food stores - August 2015
15 September 2015
2015- n° 222In August 2015, prices of frequently purchased goods increased slightly again in hyper
and supermarkets (+0.1%) Price Index in large and predominantly-food stores - August 2015
In August 2015, prices of frequently purchased goods grew by 0.1% in hyper and supermarkets, as in July.
In August 2015, prices of frequently purchased goods grew by 0.1% in hyper and supermarkets, as in July.
In stores other than hyper and supermarkets, the increase in prices of frequently purchased goods was slightly higher (+0.2%), after a stability in July.
Considering all stores, prices of frequently purchased goods were up 0.2% in August after four months of stability.
Year-on-year, the price fall of frequently purchased goods eased in hyper and supermarkets
Year-on-year, prices of frequently purchased goods decreased by 0.6% in hyper and supermarkets in August, sligthly less than during the previous months (-0.7% in July and -0.9% in May and June). In August 2014, they had gone down by 0.8% year-on-year.
In large and predominantly food stores, prices of frequently purchased goods decreased on the same pace year-on-year in August as in July (-0.7%; -0.8% in August 2014).
Considering all stores, the decrease in prices of frequently purchased goods was more moderate year-on-year (–0.3% in August, as in July).
In fact, excluding hyper and supermarkets and large and predominantly food stores, prices of frequently purchased goods rose by 0.5% year-on-year in August, after + 0.4% in July.
graphiqueGraphique1English – Frequently purchased goods price indexes year-on-year change
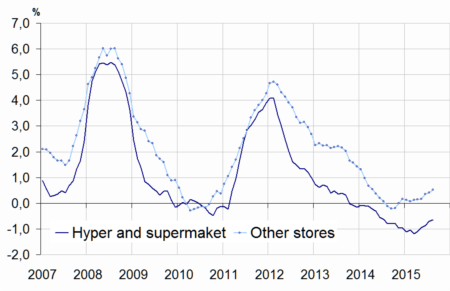
- Source: INSEE - Consumer Price Indexes
graphiqueGraphique2English – Frequently purchased goods price indexes
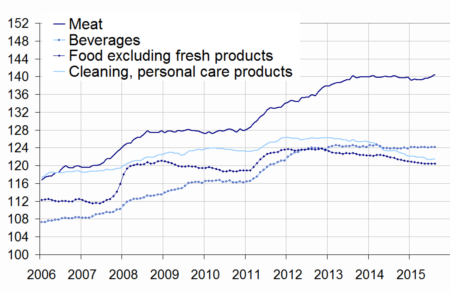
- Source: Insee - Consumer Price Indexes
tableauTableau1English – Prices of frequently purchased goods
| Index | Changes (%) compared to | ||
|---|---|---|---|
| August 2015 | Last month (m-o-m) | 12 months before (y-o-y) | |
| Hyper-and-Supermarkets (A) | 125.63 | 0.1 | -0.6 |
| Large and predominantlyfood stores (A + neighbourhood stores) | 126.67 | 0.1 | -0.7 |
| Other stores | 136.24 | 0.2 | 0.5 |
| All stores | 128.87 | 0.2 | -0.3 |
- Source: INSEE - Consumer Price Indexes
tableauTableau2English – Prices of frequently purchased goods detailed by main items
| Index | Changes (%) compared to | ||
|---|---|---|---|
| August 2015 | last month (m-o-m) | 12 months before (y-o-y) | |
| Food and beverages (excluding fresh foodstuffs) | 126.60 | 0.1 | -0.5 |
| - Meat | 140.42 | 0.3 | 0.1 |
| - Beverages | 124.19 | 0.0 | 0.2 |
| - Other food products | 120.48 | 0.0 | -1.0 |
| Clearing and personal care products | 121.59 | 0.1 | -1.5 |
| Total Hyper-and-Supermarkets | 125.63 | 0.1 | -0.6 |
- Source: INSEE - Consumer Price Indexes
Slight increase in food in hyper and supermarkets
In August 2015, prices of food excluding fresh foodstuffs were up slightly (+0.1%) in hyper and supermarkets in the wake of meat price upturn. Year-on-year, they decreased by 0.5%, as in July. In August 2014, they had declined by 0.6% year-on-year.
Prices of meat sold in hyper and supermarkets increased again (+0.3%, after +0.2% in July). Year-on-year, their rise was very modest (+0.1% after a stability in July 2015 and in August 2014).
Conversely, beverage prices were stable in August 2015 in hyper and supermarkets after a rise by 0.1% in July. Year-on-year, they increased slightly (+0.2% after +0.3% in July). In August 2014, they were down 0.5% year-on-year.
Similarly, prices of other food products (excluding fresh foodstuffs) were stable in August in hyper and supermarkets for the third month in a row. Year-on-year, they decreased by 1.0% (-1.1% in July). In August 2014, they had declined by 0.9% year-on-year.
Slight increase in prices of cleaning and personal care products in August
In August 2015, prices of cleaning and personal care products increased slightly in hyper and supermarkets (+0.1% after a stability in July). Year-on-year, they declined by 1.5% in August, as in July (-1.9% in August 2014).
Pour en savoir plus
