


 28 August 2015
2015- n° 209In July 2015, overall agricultural producer prices increased by 1.1% Indices of agricultural prices - juillet 2015
28 August 2015
2015- n° 209In July 2015, overall agricultural producer prices increased by 1.1% Indices of agricultural prices - juillet 2015
In July 2015, overall agricultural producer prices rose by 1.1% compared to June ; year over year they decreased by 1.6%
In July 2015, overall agricultural producer prices rose by 1.1% compared to June ; year over year they decreased by 1.6%
Cereal prices jumped in July (+11.1%). At the beginning of that month, soft wheat and maïze markets reacted upwardly to adverse weather conditions in Europe (drought) and in United-States (floods). Durum wheat price surged even more (+16.5%): the lack of planted areas led to a shortage.
graphiquecereal – Producer prices of cereals

- Source : Insee
Oleaginous prices slightly weakened in July (–2.0%) after a sharp rise the previous months (+18.8% yoy). The price of rape, the main oleaginous grown in France, shrunk following the tumble of oil price. The biodiesel oil, made from rape, turned less attractive by a lower price of oil.
The wine prices dipped year on year (–1.8%). The 2014 harvest was good, except in the Languedoc-Roussillon region. Hence, the prices of common wines, massively produced in that place, rose significantly (+13.1% yoy). Conversely, prices of PDO (protected designation of origin) wines decreased sharply (–9.5% yoy).
Fresh fruits prices soared (+21.2%) compared to July 2014, when they were particularly low. Apricots and peaches prices rocketed as a result of the significant decline in their production related to bad weather conditions, while the heat wave supported their consumption. The foreign competition was weak; in addition, the consumers favoured the French origin.
graphiquevegetable – Producer prices of fresh vegetables
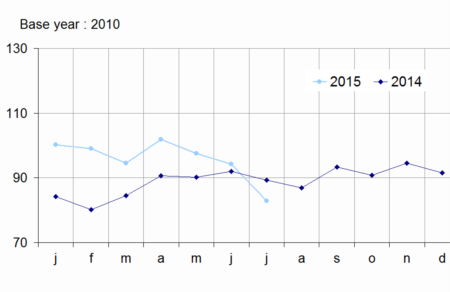
Fresh vegetable prices dropped (–7.3% yoy). Melon price plunged by a quarter. The consumption could not absorb the abundant production due to increased yields. On the other hand, cucumbers and carrots prices increased : their good quality productions were sold easily in France and abroad.
graphiquepig – Producer prices of pigs and large cattle

On a seasonally adjusted basis, animal prices rose in July by 1.0% but decreased by 3.0% over one year. Pig prices slumped by nearly 9% over this period, further to Russian embargo and European competition. Milk prices tumbled by roughly 15% over one year. In 2014, high prices encouraged the farmers to produce more, but since the global demand has slowed, due to lower Chinese demand and Russian embargo.
tableauTab1 – Indices of producer prices of agricultural products (IPPAP)
| weights | July 2015 | Variation as % over | |||
|---|---|---|---|---|---|
| a month | 3 months | a year | |||
| raw | Seasonally adjusted | raw | |||
| Agricultural goods output | 1000 | 114.0 | +1.1 | +0.3 | –1.6 |
| excluding fruits and vegetables | 900 | 116.3 | +2.0 | +1.6 | –2.0 |
| Crop output (excluding fruits and vegetables) | 505 | 118.7 | +2.9 | +3.4 | +2.1 |
| Cereals | 188 | 116.7 | +11.1 | +8.8 | +6.1 |
| of which soft wheat | 112 | 112.0 | +11.8 | +6.3 | +3.0 |
| grain maize | 41 | 105.6 | +11.7 | +12.9 | +8.7 |
| Potatoes | 26 | 109.7 | /// | /// | –0.6 |
| Wines | 177 | 128.0 | –1.8 | –1.3 | –3.3 |
| Protected designation of origin | 84 | 129.7 | –3.4 | –2.7 | –9.5 |
| other wines | 23 | 154.4 | 0.0 | +1.0 | +13.1 |
| Oleaginous | 49 | 104.6 | –2.0 | +2.1 | +18.8 |
| Horticultural products | 30 | 105.6 | –0.8 | +1.1 | –1.0 |
| Other crop products | 36 | 120.4 | +1.2 | +0.6 | +0.1 |
| Fruits and vegetables (1) | 100 | 93.4 | /// | /// | +3.4 |
| Fresh vegetables | 53 | 82.8 | /// | /// | –7.3 |
| Fresh fruits | 35 | 102.7 | /// | /// | +21.2 |
| Animal output | 395 | 113.1 | +0.7 | –0.7 | –7.0 |
| Animals | 234 | 115.8 | +1.0 | +1.0 | –3.0 |
| of which large cattle | 96 | 123.9 | +1.7 | +3.4 | +1.9 |
| calves | 26 | 101.2 | –1.2 | –6.3 | –4.4 |
| pigs | 54 | 115.5 | +1.7 | +2.3 | –8.8 |
| sheep | 10 | 110.8 | –1.0 | –6.3 | –5.3 |
| poultry | 46 | 109.9 | –0.1 | –0.1 | –4.9 |
| of which chicken | 28 | 109.7 | –0.2 | –0.4 | –5.3 |
| Milk | 147 | 107.4 | 0.0 | –5.4 | –14.6 |
| of which cow milk (2) | 137 | 107.4 | 0.0 | –5.8 | –15.5 |
| Eggs | 15 | 127.7 | +2.9 | +15.6 | +8.9 |
- (1) Including vegetables for industry.
- (2)The price for July is not yet known and therefore is estimated by carrying forward the seasonally adjusted price of June.
- Sources: Insee - SSP (ministry of agriculture)
The purchase price of means of production decreased in July
In July, intermediate consumption prices slipped again (–0.4% after –0.9%) reflecting the decline in energy prices (–3.7%). Over one year, energy prices lowered noticeably (–14.9%), as well as feed prices (–5.2%). Capital goods prices were virtually stable in July (+0.1%).
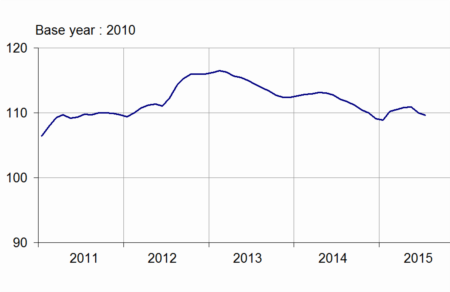
graphiquemeans – Purchase prices of the means of agricultural production
tableauTab2 – Indices of purchase prices of the means of agricultural production (IPAMPA)
| weights | July 2015 | Variation as % over | |||
|---|---|---|---|---|---|
| a month | 3 months | a year | |||
| Total input | 1000 | 109.7 | –0.3 | –1.0 | –2.2 |
| Intermediate consumptions | 764 | 110.8 | –0.4 | –1.3 | –2.9 |
| Energy | 100 | 99.9 | –3.7 | –4.7 | –14.9 |
| Seeds | 57 | 108.7 | –0.2 | –0.2 | +0.4 |
| Fertilisers and soil improvers | 92 | 117.7 | –0.1 | –4.0 | +3.1 |
| Plant protection products | 78 | 100.8 | –0.2 | –0.2 | –0.3 |
| Animal feed | 205 | 117.6 | 0.0 | –0.8 | –5.2 |
| Veterinary expenses | 43 | 113.7 | +0.2 | +0.5 | +2.1 |
| Small equipment and tools | 17 | 109.4 | +0.7 | +1.4 | +0.4 |
| Maintenance of materials | 67 | 113.3 | +0.2 | +0.3 | +1.5 |
| Maintenance of buildings | 9 | 106.9 | +0.1 | +0.1 | –0.2 |
| Other goods and services | 97 | 101.7 | +0.1 | +0.1 | –0.2 |
| Goods and services contributing to investment | 236 | 106.5 | +0.1 | –0.2 | +0.3 |
| Material | 186 | 106.9 | 0.0 | –0.3 | +0.5 |
| Tractors | 79 | 106.2 | 0.0 | –0.9 | +0.6 |
| Machinery and plant for cultivation | 36 | 109.0 | +0.1 | +0.1 | +0.7 |
| Machinery and plant for harvesting | 42 | 107.6 | +0.2 | +0.3 | +0.6 |
| Utility vehicles | 18 | 104.6 | –0.1 | –0.2 | –0.4 |
| Buildings | 50 | 104.9 | +0.1 | +0.1 | –0.4 |
- (1) The repayment of the domestic tax on energy products (TICPE) benefiting farmers has been applied in advance for the year 2015
- Sources: Insee - SSP (ministry of agriculture)
Documentation
Methodology (pdf,122 Ko)
Pour en savoir plus
Time series : Indices of agricultural prices
