


 30 June 2015
2015- n° 160In May 2015, household consumption of goods was virtually stable (+0.1%) Household consumption expenditure on goods - May 2015
30 June 2015
2015- n° 160In May 2015, household consumption of goods was virtually stable (+0.1%) Household consumption expenditure on goods - May 2015
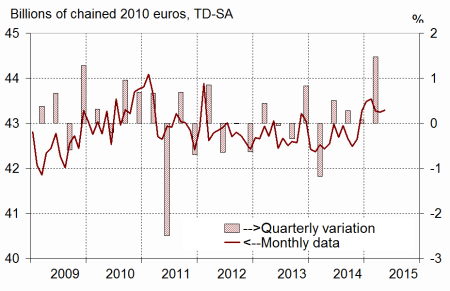
In May 2015, household consumption expenditure on goods was virtually flat: +0.1% in volume*, after 0.0% in April. In detail, consumption of energy products recovered slightly (+0.3% after –1.3% in April), while expenditure on textile, clothing and leather fell (–0.3% after +1.5%).
In May 2015, household consumption expenditure on goods was virtually flat: +0.1% in volume*, after 0.0% in April. In detail, consumption of energy products recovered slightly (+0.3% after –1.3% in April), while expenditure on textile, clothing and leather fell (–0.3% after +1.5%).
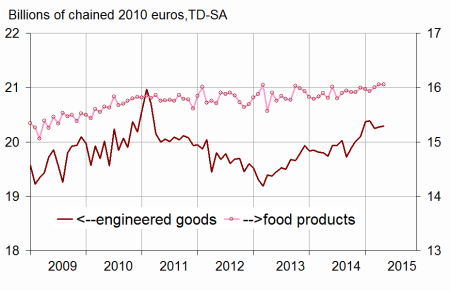
Engineered goods : virtually stable
In May, household consumption of engineered goods was virtually stable (+0.1%, as in April).
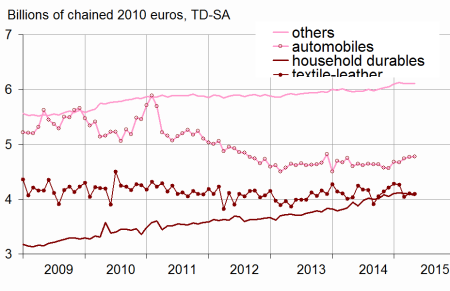
Durables: slight rebound in May
In May, household expenditure on durable goods bounced back slightly (+0.2% after –0.3% in April). In detail, expenditure on household durables declined for the third month in a row (–0.6%, after –0.2% in March and in April). Conversely, car purchases continued to rise albeit at a somewhat slower pace (+0.2% after +0.4%).
Textile-leather: slight downturn
Consumption of textile, clothing and leather eased back slightly in May (–0.3% after +1.5% in April and –5.1% in March).
Other engineered goods: near stability
In May, consumption expenditure on other engineered goods were almost stable again (+0.1% after –0.1% in April).
[* Volumes are measured at previous year’s prices 2010 chain-linked, and all figures are trading days and seasonally adjusted.]
graphiquegraph1_new_ang – Total consumption of goods
graphiquegraph2_new_ang – Food and engineered goods
graphiquegraph3_new_ang – Breakdown of engineered goods
Food products: stability
In May, consumption of food products held steady (after +0.3% in April).
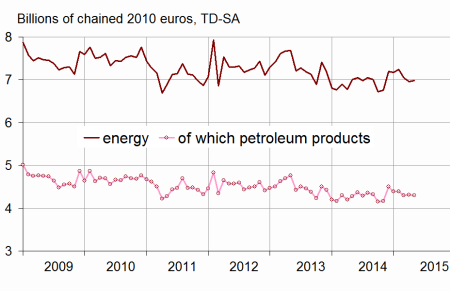
Energy: slight rebound
In May, household consumption of energy products picked up slightly (+0.3%), after a decrease in April (–1.3%). This rebound was mainly buoyed by the increase in electricity expenditure, whereas consumption expenditure on petroleum products receded (–0.3%).
The variation in April 2015 is scaled down by 0.1 point
Household consumption of goods is scaled down by 0.1 point in April 2015, now estimated at 0.0% instead of +0.1% in the previous publication, due notably to energy consumption.
This revision ensued from the integration of more recent data on the indicators commonly used as well as from the update of the seasonal adjustment coefficients.
graphiquegraph4_new_ang – Energy
tableautab1_eng – Household consumption expenditure on goods
| March | April | May | May2015/ | |
|---|---|---|---|---|
| 2015 | 2015 | 2015 | May2014 | |
| Food products | 16.003 | 16.057 | 16.058 | |
| Change (%) | 0.5 | 0.3 | 0.0 | 1.6 |
| Engineered goods | 20.244 | 20.273 | 20.290 | |
| Change (%) | –0.7 | 0.1 | 0.1 | 2.8 |
| Durables | 10.096 | 10.066 | 10.090 | |
| Change (%) | 1.0 | –0.3 | 0.2 | 3.6 |
| - of which automobiles | 4.744 | 4.763 | 4.774 | |
| Change (%) | 1.5 | 0.4 | 0.2 | 3.8 |
| - of which household durables | 4.102 | 4.092 | 4.068 | |
| Change (%) | –0.2 | –0.2 | –0.6 | 3.0 |
| Textile-leather | 4.045 | 4.107 | 4.093 | |
| Change (%) | –5.1 | 1.5 | –0.3 | 1.5 |
| Other engineered goods | 6.111 | 6.105 | 6.112 | |
| Change (%) | –0.3 | –0.1 | 0.1 | 2.5 |
| Energy | 7.046 | 6.957 | 6.979 | |
| Change (%) | –2.7 | –1.3 | 0.3 | –0.4 |
| - including petroleum products | 4.301 | 4.317 | 4.304 | |
| Change (%) | –2.2 | 0.4 | –0.3 | 0.6 |
| Total | 43.265 | 43.249 | 43.289 | |
| Change (%) | –0.6 | 0.0 | 0.1 | 1.8 |
| Manufactured goods | 37.044 | 37.192 | 37.200 | |
| Change (%) | –0.4 | 0.4 | 0.0 | 2.6 |
Documentation
Methodology (pdf,23 Ko)
Pour en savoir plus
